python 包介绍:osmnx
1 osmnx介绍
一个Python 包,可检索、建模、分析和可视化来自 OpenstreetMap 的街道网络。
2 graph模块
graph类型就是networkx 包中的graph类型。所以python库整理:networkx 包_UQI-LIUWJ的博客-CSDN博客中G的操作这里的G都可以
2.1 graph_from_point
osmnx.graph.graph_from_point(
    center_point,
    dist=1000,
    dist_type='bbox',
    network_type='all_private',
    simplify=True,
    retain_all=False,
    truncate_by_edge=False,
    clean_periphery=True,
custom_filter=None)| center_point (tuple) | 围绕其构建图形的经纬度坐标 |
| dist (int) | 仅保留图中心这么多米内的那些节点,距离根据 dist_type 参数确定 |
| dist_type (string {"network", "bbox"}) | 如果为“bbox”,则仅保留距离参数的边界框内的那些节点。 如果是“network”,则仅保留距最中心节点一定网络距离内的那些节点。 |
| network_type (string, {"all_private", "all", "bike", "drive", "drive_service", "walk"}) | 获得什么类型的街道网络 |
| simplify (bool) | 如果为真,使用simple_graph 函数简化图拓扑 |
| retain_all (bool) | 如果为 True,即使未连接也返回整个图。 否则,只保留最大的弱连通分量。 |
| truncate_by_edge (bool) | 如果为真,如果至少一个节点的邻居在边界框内,则保留这个边界框外的节点 |
2.2 graph_from_place
osmnx.graph.graph_from_place(
    query,
    network_type='all_private',
    simplify=True,
    retain_all=False,
    truncate_by_edge=False,
    which_result=None,
    buffer_dist=None,
    clean_periphery=True,
custom_filter=None)| query (string or dict or list) | 对地理编码的查询或查询以获取地点边界多边形 |
| network_type (string {"all_private", "all", "bike", "drive", "drive_service", "walk"}) | 获得什么类型的街道网络 |
| simplify (bool) | 如果为真,使用simple_graph 函数简化图拓扑 |
| retain_all (bool) | 如果为 True,即使未连接也返回整个图。 否则,只保留最大的弱连通分量。 |
| truncate_by_edge (bool) | 如果为真,如果至少一个节点的邻居在边界框内,则保留这个边界框外的节点 |
3 plot模块
3.1 plot_graph
osmnx.plot.plot_graph(
    G,
    ax=None,
    figsize=(8, 8),
    bgcolor='#111111',
    node_color='w',
    node_size=15,
    node_alpha=None,
    node_edgecolor='none',
    node_zorder=1,
    edge_color='#999999',
    edge_linewidth=1,
    edge_alpha=None,
    show=True,
    close=False,
    save=False,
    filepath=None,
    dpi=300,
bbox=None)| G (networkx.MultiDiGraph) | 需要绘制的图 |
| ax (matplotlib axis) | 如果不是无,则在此预先存在的轴上绘图 |
| figsize (tuple) | 和matplotlib的一致 |
| bgcolor (string) | 背景颜色 |
| node_color (string or list) | 点的颜色 |
| node_size (int) | 点的大小,如果是0的话,不画点 |
| node_alpha (float) | 点的透明度 |
| node_edgecolor (string) | 点边框的颜色 |
| edge_color (string or list) | 边的颜色 |
| edge_linewidth (float) | 边的宽度 |
| edge_alpha (float) | 边的透明度 |
| show (bool) | 如果为 True,则调用 pyplot.show() 来显示图形 |
| close (bool) | 如果为 True,则调用 pyplot.close() 来关闭图形 |
| save (bool) | 如果为 True,则将图形保存到filepath去 |
| filepath (string) | 保存的路径 |
eg
location_point = (31.20799,121.547812)
G1 = ox.graph_from_point(location_point, dist=2000)
fig, ax = ox.plot_graph(G1, node_color='r')
3.2 plot_graph_route
osmnx 笔记: plot_graph_route & plot_graph_routes_UQI-LIUWJ的博客-CSDN博客
3.3 plot_graph_routes
osmnx 笔记: plot_graph_route & plot_graph_routes_UQI-LIUWJ的博客-CSDN博客
3.4 get_colors
从matplotlib颜色映射中获取n个均匀间距的颜色。
3.4.1 基本使用方法
osmnx.plot.get_colors(
    n,
    cmap='viridis',
    start=0.0,
    stop=1.0,
    alpha=1.0,
    return_hex=False)
3.4.2 参数说明
| n (int) | 划分的颜色数 |
| cmap (string) |
|
| start (float) | 颜色空间的起始位置 |
| stop (float) | 颜色空间的结束位置 |
| alpha (float) | 透明度 |
| return_hex (bool) | 如果为True,将RGBa颜色转换为类似html的十六进制RGB字符串。 如果为False,返回(R, G, B, alpha)元组的颜色。 |
3.4.3 使用举例
ox.plot.get_colors(10,cmap='Greens')
'''
[(0.9686274509803922, 0.9882352941176471, 0.9607843137254902, 1.0),
 (0.9066205305651672, 0.9641214917339485, 0.8884429065743944, 1.0),
 (0.8089965397923875, 0.9251672433679354, 0.7834525182622069, 1.0),
 (0.681045751633987, 0.8718954248366013, 0.6562091503267974, 1.0),
 (0.5351787773933102, 0.8060899653979239, 0.5287504805843906, 1.0),
 (0.36392156862745095, 0.7240292195309497, 0.4181468665897732, 1.0),
 (0.21568627450980393, 0.6287581699346405, 0.3333333333333333, 1.0),
 (0.10388312187620147, 0.5164936562860438, 0.2467512495194156, 1.0),
 (0.0, 0.4079046520569012, 0.16444444444444445, 1.0),
 (0.0, 0.26666666666666666, 0.10588235294117647, 1.0)]
'''


ox.plot.get_colors(10,cmap='Greens',return_hex=True)
'''
['#f7fcf5',
 '#e7f6e3',
 '#ceecc8',
 '#aedea7',
 '#88ce87',
 '#5db96b',
 '#37a055',
 '#1a843f',
 '#00682a',
 '#00441b']
'''
3.5 get_edge_colors_by_attr &get_node_colors_by_attr
osmnx 补充笔记:get_edge_colors_by_attr &get_node_colors_by_attr_UQI-LIUWJ的博客-CSDN博客
4 simplification模块
4.1 _is_endpoint
节点是边的真正端点吗?
如果节点是网络中边的“真实”端点,则返回 True,否则返回 False。
OSM 数据包括许多仅作为点存在的节点,以帮助街道绕曲线弯曲。
osmnx.simplification._is_endpoint(
    G,
    node,
    strict=True)
G-图,node-需要判断的点
G1=ox.graph_from_place('Pudong,Shanghai,China',
                                  network_type='drive')
nc = ['white' if ox.simplification._is_endpoint(G1, node) else 'black' for node in G1.nodes()]
ox.plot_graph(G1,figsize=(20,20),node_color=nc)
4.2 simplify_graph
osmnx.simplification.simplify_graph(
    G,
    strict=True,
    remove_rings=True)
通过移除间隙节点来简化图的拓扑。
通过删除所有非交点或终端的节点来简化图拓扑。
在封装它们的端点之间直接创建一条边,但保留原始边的几何形状,并保存为新边上的新几何属性。
注意,只有简化的边才能接收几何属性。一些合并后的边可能包含多种OSM方式,如果是这样,它们的多个属性值将存储为一个列表。
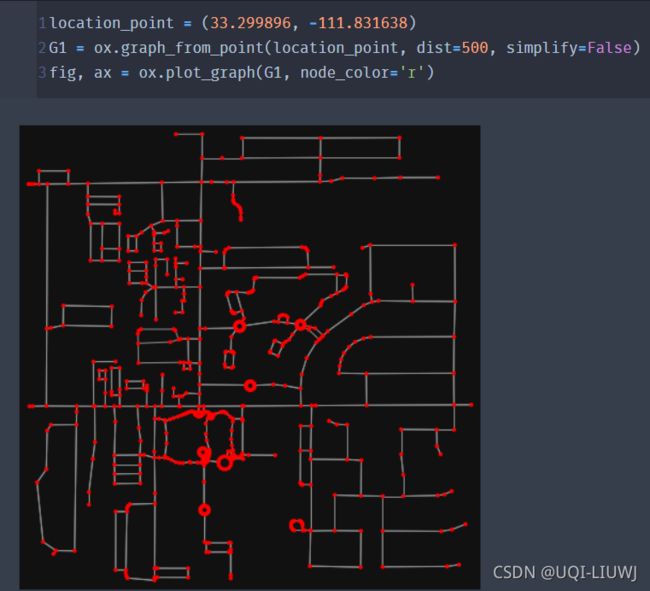
注:如果之前在比如ox.graph_from_point的地方,没有设置 'simplify=False',那么这里会报错:
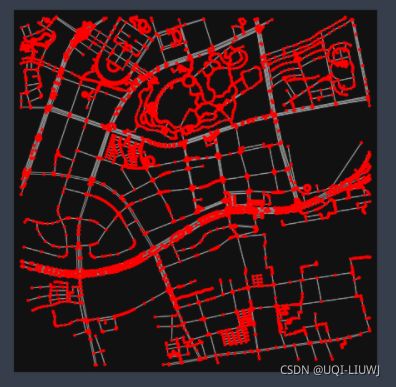
Exception: This graph has already been simplified, cannot simplify it again.eg,这是没有简化的图:
location_point = (31.20799,121.547812)
G1 = ox.graph_from_point(location_point, dist=2000,simplify=False)
fig, ax = ox.plot_graph(G1, node_color='r')
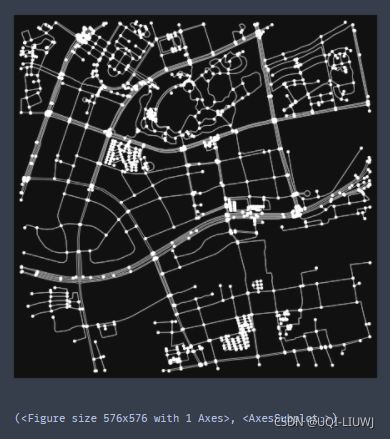
这是简化了之后的图:
G2=ox.simplification.simplify_graph(G1)
ox.plot_graph(G2)
5 io模块
5.1 load_graphml
osmnx.io.load_graphml(
    filepath,
    node_dtypes=None,
    edge_dtypes=None,
    graph_dtypes=None)
5.1.1 参数说明
filepath (string or pathlib.Path) GraphML文件的路径 node_dtypes (dict) 点级别属性名字的字典 edge_dtypes (dict) 边级别属性名字的字典 graph_dtypes (dict) 图级别属性名字的字典
5.1.2 用法说明
从磁盘加载osmnx保存的GraphML文件。
这将节点、边和图形级属性(序列化为字符串)转换为相应的数据类型。
可以根据需要通过传入提供类型或自定义转换器函数的dtypes参数来定制这些参数。
例如,如果想将某些属性的值转换为bool类型,可以考虑使用内置的ox.io._convert_bool_string函数:
ox.load_graphml(fp, node_dtypes={my_attr: ox.io._convert_bool_string})如果你手工设置了’all_oneway=True‘,那么你需要将边的oneway属性设置为str
5.1.3 使用举例
G = ox.io.load_graphml("./graph.graphml")
fig, ax = ox.plot_graph(G, node_size=0, edge_color='w', edge_linewidth=0.25)
5.2 save_graphml
osmnx.io.save_graphml(
    G,
    filepath=None,
    gephi=False,
    encoding='utf-8')
将G保存成graphml格式的文件
6 utils_graph模块
6.1 graph_to_gdfs
osmnx.utils_graph.graph_to_gdfs(
    G,
    nodes=True,
    edges=True,
    node_geometry=True,
    fill_edge_geometry=True)
Convert a MultiDiGraph to node and/or edge GeoDataFrames.
返回:geopandas.GeoDataFrame
参数:
| G (networkx.MultiDiGraph) | 输入的图 |
| nodes (bool) | 如果是True,那么将图的节点转化成GeoDataFrame |
| edges (bool) | 如果是True,那么将图的边转化成GeoDataFrame |
| node_geometry (bool) | 如果为True,从节点x和y属性创建一个几何列 |
| fill_edge_geometry (bool) | 如果为True,使用节点u和v填充缺失的边几何字段 |
Gdf_nodes或gdf_edges或元组(Gdf_nodes, gdf_edges).gdf_nodes由osmid索引.
gdf_edges由u, v, key按照正常的multidiggraph结构进行多重索引。


