seaborn散点图_Seaborn散点图–终极指南
seaborn散点图
Hey, folks! In the series of Data Visualization with Seaborn, will be focusing on Seaborn Scatter Plots for data visualization.
嘿伙计! 在“ Seaborn的数据可视化 ”系列文章中,将重点介绍用于数据可视化的Seaborn散点图 。
什么是散点图? (What is a Scatter Plot?)
Scatter Plot represents the relationship between two continuous values, respectively. It depicts how one data variable gets affected by the other data variable in every fraction of the value of the data set.
散点图分别表示两个连续值之间的关系。 它描述了在数据集值的每一部分中,一个数据变量如何受到另一数据变量的影响。
So, now let us start with plotting Scatter Plots using the Seaborn Library.
因此,现在让我们开始使用Seaborn Library绘制散点图 。
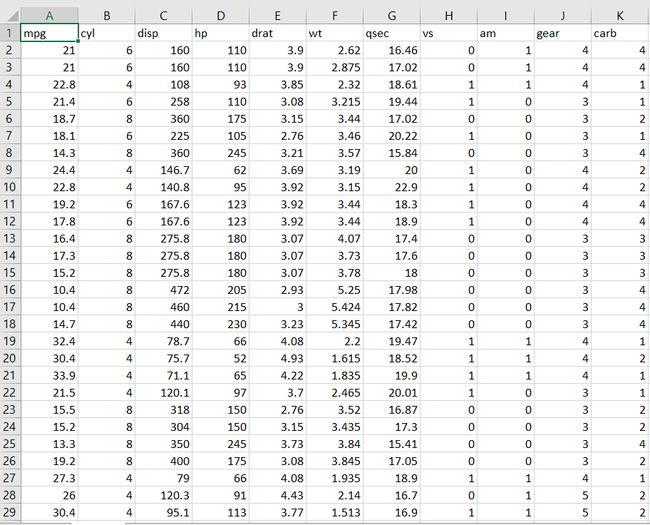
We will be using the below data set through out the article for data input.
在整篇文章中,我们将使用以下数据集进行数据输入。
Seaborn散点图入门 (Getting started with Seaborn Scatter Plot)
Before moving ahead with the plotting, we need to install the Seaborn Library using the below command:
在进行打印之前,我们需要使用以下命令安装Seaborn Library:
pip install seaborn
After having installed the library, we need to import the library into the Python environment to load the functions and plot the data to visualize it using the below command:
安装库之后,我们需要将库导入Python环境中以加载函数并绘制数据以使用以下命令将其可视化:
import seaborn
创建散点图 (Creating a Scatter Plot)
The seaborn.scatterplot() function is used to plot the data and depict the relationship between the values using the scatter visualization.
seaborn.scatterplot() function用于绘制数据并使用散点图可视化描述值之间的关系。
Syntax:
句法:
seaborn.scatterplot(x,y,data)
x: Data variable that needs to be plotted on the x-axis.x:需要在x轴上绘制的数据变量。y: The data variable to be plotted on the y-axis.y:要在y轴上绘制的数据变量。data: The pointer variable wherein the entire data is stored.data:指针变量,其中存储了整个数据。
Example 1:
范例1:
import pandas as pd
import seaborn as sns
import matplotlib.pyplot as plt

Year = [1,3,5,2,12,5,65,12,4,76,45,23,98,67,32,12,90]
Profit = [80, 75.8, 74, 65, 99.5, 19, 33.6,23,45,12,86,34,567,21,80,34,54]


data_plot = pd.DataFrame({"Year":Year, "Profit":Profit})


sns.scatterplot(x = "Year", y = "Profit", data=data_plot)
plt.show()
In the above example, we have plotted the relationship between the ‘Year’ and ‘Profit’ using the scatter plot. Moreover, we have used the pyplot.show() function to present the data in a proper plot format.
在上面的示例中,我们使用散点图绘制了“年”和“利润”之间的关系。 此外,我们使用pyplot.show()函数以正确的绘图格式显示数据。
Output:
输出:
Example 2:
范例2:
import pandas as pd
import seaborn as sns
import matplotlib.pyplot as plt

data = pd.read_csv("C:/mtcars.csv")
sns.scatterplot(x = "drat", y = "qsec",data=data)
sns.set(style='darkgrid',)
plt.show()
In the above example, we have represented the relationship between two data columns of a data set passed to the function as a parameter.
在上面的示例中,我们已经表示了作为参数传递给函数的数据集的两个数据列之间的关系。
Output:
输出:
在Seaborn散点图中分组变量 (Grouping variables in Seaborn Scatter Plot)
As seen above, a scatter plot depicts the relationship between two factors. We can further depict the relationship between multiple data variables i.e. how does the variation in one data variable affects the representation of the other data variables on a whole plot.
如上所示,散点图描述了两个因素之间的关系。 我们可以进一步描述多个数据变量之间的关系,即一个数据变量的变化如何影响整个图中其他数据变量的表示。
In the upcoming section, will be having a look at the below ways through which we can depict the multivariable relatiopnship–
在接下来的部分中,我们将研究以下方式,我们可以通过这些方式来描述多变量相关性:
- hue 色调
- style 样式
- size 尺寸
1.使用参数“色相” (1. Using the parameter ‘hue’)
The hue parameter can be used to group the multiple data variables and show dependency between them in terms of different colors of the markers used to plot the data values.
hue参数可用于对多个数据变量进行分组,并根据用于绘制数据值的标记的不同颜色来显示它们之间的依赖性。
Syntax:
句法:
seaborn.scatterplot(x,y,data,hue)
hue: The data parameter around which the dependency of the passed data values are to be plotted.hue:数据参数,围绕该数据参数绘制传递的数据值的依赖性。
Example:
例:
import pandas as pd
import seaborn as sns
import matplotlib.pyplot as plt

data = pd.read_csv("C:/mtcars.csv")
sns.scatterplot(x = "drat", y = "qsec",data=data, hue='am')
sns.set(style='whitegrid',)
plt.show()
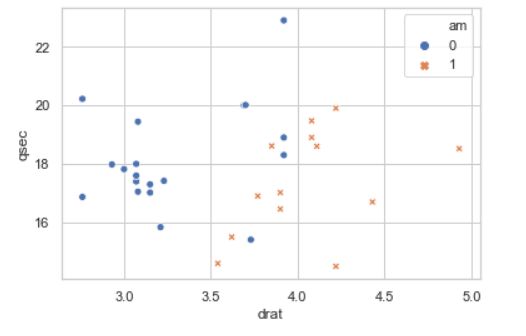
In the above example, we have plotted the dependency between ‘drat‘ and ‘qsec‘ data variables against the data variable ‘am‘ of the dataset. The data variable is a categorical variable i.e. the data values lies between 0-1. Thus using hue, the two data values 0 and 1 of variable am are represented using two different colours.
在上面的例子中,我们绘制之间的依赖关系“DRAT”和“QseC的 ”对数据集的数据变量“AM”数据变量。 数据变量是分类变量,即数据值介于0-1之间。 因此,使用色相,使用两种不同的颜色表示变量am的两个数据值0和1。
Output:
输出:
2.参数“样式” (2. The parameter ‘style’)
Using style as a parameter, we can depict the relationship between multiple data variables and their dependency using different types of scatter icons used to depict the data values.
使用style作为参数,我们可以使用用于描述数据值的不同类型的散布图标来描述多个数据变量及其依赖性之间的关系。
Syntax:
句法:
seaborn.scatterplot(x,y,data,style)
style: The data parameter which acts as a reference to plot the multivariable relationship.style:数据参数,用作绘制多变量关系的参考。
Example:
例:
import pandas as pd
import seaborn as sns
import matplotlib.pyplot as plt

data = pd.read_csv("C:/mtcars.csv")
sns.scatterplot(x = "drat", y = "qsec",data=data, hue='am',style='am')
sns.set(style='whitegrid',)
plt.show()
In the above example, the different pattern of plots like ‘o‘ and ‘x‘ helps depict the dependency between x, y-axis variables keeping ‘am’ variable as a reference.
在上面的示例中,像“ o ”和“ x ”这样的图形的不同模式有助于描绘x,y轴变量之间的相关性,并保持“ am”变量为参考。
Output:
输出:
3.使用参数“大小” (3. Using parameter ‘size’)
The size parameter produces the plot in such a manner that the dependency and relationship between the multiple plots is depicted using scatter patterns of different sizes.
size参数以一种方式生成图,从而使用不同大小的散布图来描述多个图之间的依存关系。
Syntax:
句法:
seaborn.scatterplot(x,y,data,size)
Example:
例:
import pandas as pd
import seaborn as sns
import matplotlib.pyplot as plt

data = pd.read_csv("C:/mtcars.csv")
sns.scatterplot(x = "drat", y = "qsec",data=data,size='am',hue='am')
sns.set(style='whitegrid',)
plt.show()
As seen clearly, the scatter markers of different size help depict the relationship between the data values passed to it as parameter, as a reference.
可以清楚地看到,不同大小的散布标记有助于描述作为参数传递给它的数据值之间的关系,以作为参考。
Output:
输出:
使用“调色板”参数的Seaborn散点图 (Seaborn Scatter Plot using “palette” parameter)
We can visualize the data in a better manner using Seaborn palette. The inclusion of palette parameter helps us represent the data with different Seaborn colormap values.
我们可以使用Seaborn调色板以更好的方式可视化数据。 包含palette参数有助于我们用不同的Seaborn色彩图值表示数据。
Various palette colors available in the Seaborn colormap which help plot the data values.
Seaborn色彩图中可用的各种调色板颜色可帮助绘制数据值。
Example 1:
范例1:
import pandas as pd
import seaborn as sns
import matplotlib.pyplot as plt

data = pd.read_csv("C:/mtcars.csv")

sns.scatterplot(x = "drat", y = "qsec",data=data,size='am',hue='am',palette='Spectral')
sns.set(style='whitegrid',)
plt.show()
In the above example, we have made use of the palette ‘Spectral‘ to visualize the data.
在上面的示例中,我们使用了调色板' Spectral '来可视化数据。
Output:
输出:
Example 2:
范例2:
import pandas as pd
import seaborn as sns
import matplotlib.pyplot as plt

data = pd.read_csv("C:/mtcars.csv")

sns.scatterplot(x = "drat", y = "qsec",data=data,size='am',hue='am',palette='hot')
sns.set(style='whitegrid',)
plt.show()
In this example, we have used the palette ‘hot‘ along with size parameter to depict different colormap along with size of the scatter markers.
在此示例中,我们使用了调色板“ hot ”以及size参数来描绘不同的颜色图以及散布标记的大小。
Output:
输出:
使用“标记”可视化散点图 (Visualizing the Scatter Plot using ‘marker’)
The markers are the scatter patterns that are used to represent the data values. Using markers can help add value to the plot in terms of graphics and visualization.
markers是用于表示数据值的散布模式。 使用标记可以帮助在图形和可视化方面为绘图增加价值。
Syntax:
句法:
seaborn.scatterplot(x,y,markers)
markers: The list representing the marker designs we want to be inculcated in the plot.markers:代表我们要在绘图中灌输的标记设计的列表。
Example:
例:
import pandas as pd
import seaborn as sns
import matplotlib.pyplot as plt

data = pd.read_csv("C:/mtcars.csv")

sns.scatterplot(x = "drat", y = "qsec", data=data, hue='am', style='am', markers=['*', 'o'], palette='hot')
sns.set(style='dark',)
plt.show()
Output:
输出:
Seaborn散点图一览! (Seaborn Scatter Plot at a Glance!)
Thus, in this article, we have understood the actual meaning of scatter plot i.e. depicting the dependency between the data variables. Moreover, we can make use of various parameters such as ‘hue‘, ‘palette‘, ‘style‘, ‘size‘ and ‘markers‘ to enhance the plot and avail a much better pictorial representation of the plot.
因此,在本文中,我们已经了解了散点图的实际含义,即描述了数据变量之间的依赖性。 此外,我们可以利用各种参数,例如“ 色调 ”,“ 调色板 ”,“ 样式 ”,“ 大小 ”和“ 标记 ”来增强绘图并更好地利用绘图的图形表示。
Important Note: The Seaborn library and its functions are completely build upon the Matplotlib library. Thus, I recommended you to go through the Python Matplotlib tutorial.
重要说明 :Seaborn库及其功能完全基于Matplotlib库构建。 因此,我建议您阅读Python Matplotlib教程 。
结论 (Conclusion)
Thus, we have understood and implemented Seaborn Scatter Plots in Python.
因此,我们已经在Python中理解并实现了Seaborn散点图。
I strongly recommend you to go through the Seaborn tutorial to have a better understanding about the topic.
我强烈建议您阅读Seaborn教程 ,以更好地了解该主题。
参考资料 (References)
- Seaborn Scatter Plot — Official Documentation Seaborn散点图—官方文档
翻译自: https://www.journaldev.com/39381/seaborn-scatter-plot
seaborn散点图


