使用Python对数据进行描述性统计(机器学习)
使用Python对数据进行描述性统计
数据集:diabetes.csv
参考书:《Machine Learning Mastery With Python Understand Your Data, Create Accurate Models and work Projects End-to-End》
获取链接:https://github.com/aoyinke/ML_learner
Additional Knowledge
- 当两个变量相关时,用于评估它们因相关而产生的对应变量的影响。
当多个变量独立时,用方差来评估这种影响的差异。
当多个变量相关时,用协方差来评估这种影响的差异。
总览
- 一些常见的指标,例如维度,前多少行数据等
- 皮尔逊相关系数和偏度分别观察多变量和单变量
- 直方图,密度图,箱线图的代码演示和讲解
- 多变量的可视化
一些常见的指标
from pandas import read_csv

path = "diabetes.csv"
names = ['preg', 'plas', 'pres', 'skin', 'test', 'mass', 'pedi', 'age', 'class']
data = read_csv(path,names=names,skiprows=1)

# 观察数据的前5行
print(data.head())
# 观察数据的维度
print(data.shape)
"""
   preg  plas  pres  skin  test  mass   pedi  age  class
0     6   148    72    35     0  33.6  0.627   50      1
1     1    85    66    29     0  26.6  0.351   31      0
2     8   183    64     0     0  23.3  0.672   32      1
3     1    89    66    23    94  28.1  0.167   21      0
4     0   137    40    35   168  43.1  2.288   33      1

(768, 9) 768行,9列

"""
# 观测每种数据的类型
print(types)

"""
preg int64
plas int64
pres int64
skin int64
test int64
mass float64
pedi float64
age int64
class int64

"""
使用Pandas进行描述性统计
from pandas import set_option
set_option('display.width', 100)
set_option('precision', 3)
description = data.describe()
print(description)
- count:计算的是对应属性下,所有非null数据的条数
- mean,max,min分别是该属性下所有数据的平均值,最大值和最小值
- std:观测值的标准差
- 注意,对于不同类型的数据会有不同的统计项目,例如对于对象类型的数据,返回的就是: count, unique, top, and freq这几个指标
- 可以参考官方文档:pandas.DataFrame.describe
Class Distribution(仅限于classfication问题)
class_counts = data.groupby('class').size()
print(class_counts)
"""
   class
0   500
1   268
"""
Correlation between attributes(属性之间的关系)
- 对于线性回归和逻辑回归等机器学习算法来说,如果属性之间的相关程度过高,会导致比较糟糕的performance
- Pearson’s Correlation Coefficient(皮尔逊积矩相关系数) 常用于计算属性之间的相关程度,它假设所涉及的属性呈正态分布
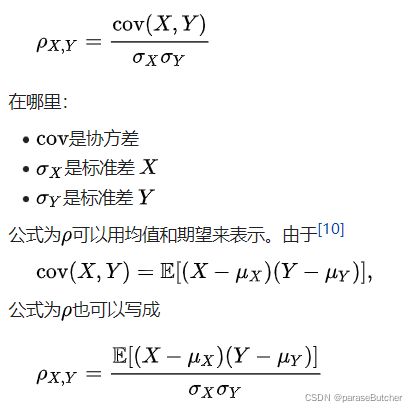
- 皮尔逊相关系数是两个变量的协方差除以其标准差的乘积
- 0表示不相关,相关因子分布在-1-1之间,正数表示相关,负数表示无关
- 举个简单的栗子,可以预期高中青少年样本的年龄和身高的 Pearson 相关系数显着大于 0,但小于 1(因为 1 表示不切实际的完美相关)
from pandas import set_option,read_csv
data = read_csv(filename, names=names)
set_option('display.width', 100)
set_option('precision', 3)
correlations = data.corr(method='pearson')
print(correlations)
Skew of Univariate Distributions(单变量分布的偏度)
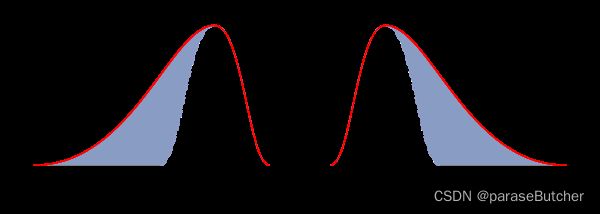
公式中,Sk——偏度;E——期望;μ——平均值;μ3——3阶中心矩;σ——标准差。 在一般情形下,当统计数据为右偏分布时,Sk>0,且Sk值越大,右偏程度越高;
当统计数据为左偏分布时,Sk< 0,且Sk值越小,左偏程度越高。当统计数据为对称分布时,显然有Sk= 0。
所以我们应该注意处理skew较大(绝对值)的变量
skew = data.skew()
print(skew)

"""
preg 0.901674
plas 0.173754
pres -1.843608
skin 0.109372
test 2.272251
mass -0.428982
pedi 1.919911
age 1.129597
class 0.635017
"""
Univariate Plots (单变量可视化观察数据)
Histograms(直方图)
# Univariate Histograms
from matplotlib.pyplot as plt
from pandas import read_csv
path = "diabetes.csv"
names = ['preg', 'plas', 'pres', 'skin', 'test', 'mass', 'pedi', 'age', 'class']
data = read_csv(path , names=names,skiprows=1)
data.hist()
plt.show()
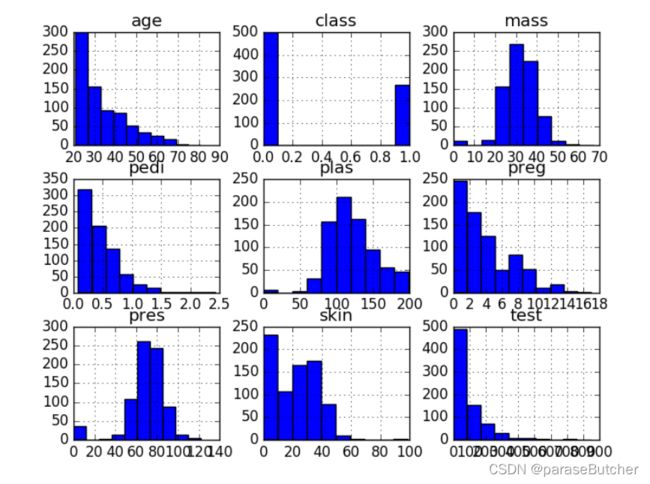
- age, pedi and test呈现指数分布(exponential distribution)
- mass and pres and plas呈现或近似高斯(正态)分布(Gaussian Distribution)
- 许多机器学习算法假定输入为正态分布,但是我们可以看到实际并不是这样(需要进行standardlization进一步处理)
Density Plots(密度图)
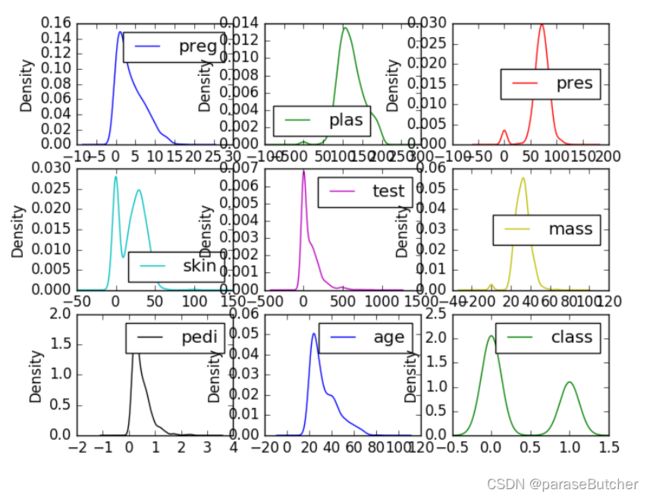
密度图是快速了解每个属性分布的另一种方法
data.plot(kind=✬density✬, subplots=True, layout=(3,3), sharex=False)
plt.show()
Box and Whisker Plots(箱线图)
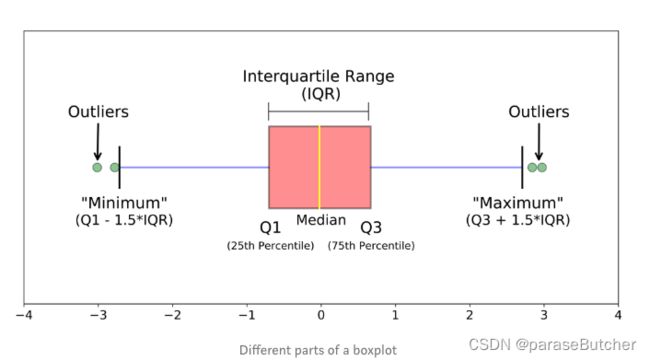
- 中位数(Q2 / 50th百分位数):数据集的中间值;
- 第一个四分位数(Q1 / 25百分位数):最小数(不是“最小值”)和数据集的中位数之间的中间数;
- 第三四分位数(Q3 / 75th Percentile):数据集的中位数和最大值之间的中间值(不是“最大值”);
- 四分位间距(IQR):第25至第75个百分点的距离;
- 晶须(蓝色显示)
- 离群值(显示为绿色圆圈)
- “最大”:Q3 + 1.5 * IQR
- “最低”:Q1 -1.5 * IQR
总结:
- 箱线图是针对连续型变量的,解读时候重点关注平均水平、波动程度和异常值。
- 当箱子被压得很扁,或者有很多异常的时候,试着做对数变换。
- 当只有一个连续型变量时,并不适合画箱线图,直方图是更常见的选择。
- 箱线图最有效的使用途径是作比较,配合一个或者多个定性数据,画分组箱线图
data.plot(kind='box', subplots=True, layout=(3,3), sharex=False, sharey=False)
plt.show()
Multivariate Plots(多变量观察)
Correlation Matrix Plot(皮尔逊相关系数,变量之间的关系)
import matplotlib.pyplot as plt
import numpy as np
from pandas import read_csv

path = "diabetes.csv"
names = ['preg', 'plas', 'pres', 'skin', 'test', 'mass', 'pedi', 'age', 'class']
data = read_csv(filename, names=names)
correlations = data.corr(method='pearson') # 得到皮尔逊相关系数
# plot correlation matrix
fig = plt.figure() # 相当于拿到一张画布
ax = fig.add_subplot(1,1,1) # 创建一个一行一列的子图
cax = ax.matshow(correlations, vmin=-1, vmax=1)
fig.colorbar(cax) # 将色彩变化条(右边那一竖着的)添加到图中
ticks = np.arange(0,9,1)
# ticks = [0 1 2 3 4 5 6 7 8] 构造一个0-8,step=1的np数组
ax.set_xticks(ticks)
ax.set_yticks(ticks)
ax.set_xticklabels(names) # 打上index,默认采用数字
ax.set_yticklabels(names)
plt.show()
Scatter Plot Matrix(散点矩阵)
from matplotlib.pyplot as plt
from pandas import read_csv
from pandas.tools.plotting import scatter_matrix
path = "diabetes.csv"
names = ['preg', 'plas', 'pres', 'skin', 'test', 'mass', 'pedi', 'age', 'class']
data = read_csv(filename, names=names)
scatter_matrix(data)
plt.show()
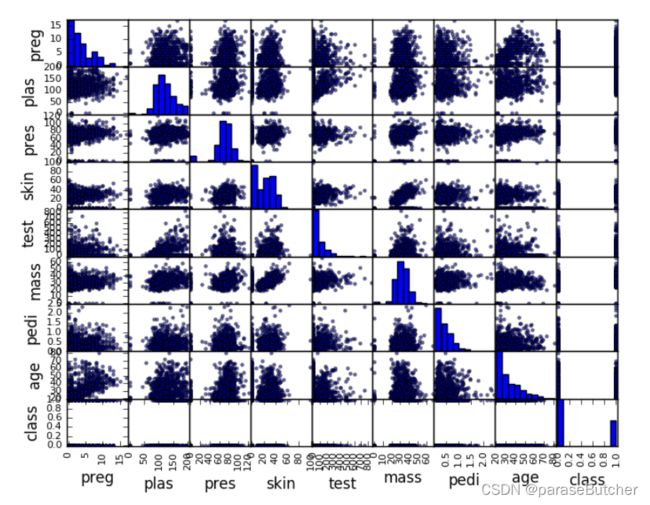
- 对角线显示每个属性的直方图。
- 散点图对于发现变量之间的结构化关系很有用,比如您是否可以用一条直线来总结两个变量之间的关系。具有结构化关系的属性也可能是相关的,可以从数据集中删除。

