matplotlib设置画布figure()、子图subplot2grid()及文字text()和annotate()
摘要:matplotlib的函数解析
------------------------------------------------------------------------------------------------------------------
设置画布:figure()
设置子图:subplot()和subplot2grid()
设置文字:text()
设置注释:annotate()
在图表中显示中文字体
# 导入绘图模块
import matplotlib.pyplot as plt

# 在图表中显示中文字体
from pylab import mpl  # 在图表中显示中文字体

# ------------------------------------------------------------------
mpl.rcParams["font.sans-serif"] = ["SimHei"]  # 以黑体显示中文
mpl.rcParams["axes.unicode_minus"] = False  # 解决负号-显示错误问题
# -----------------------------------------------------------------------------------------

# 设置画布
fig = plt.figure(figsize=(12, 9), dpi=300)
设置画布:figure()
matplotlib.pyplot.figure(num=None, figsize=None, dpi=None, facecolor=None, edgecolor=None, frameon=True)
- num:图像编号或名称,数字为编号 ,字符串为名称
- figsize:指定figure的宽和高,单位为英寸;
- dpi:指定绘图对象的分辨率,即每英寸多少个像素,缺省值为80
- facecolor:背景颜色
- edgecolor:边框颜色
- frameon:是否显示边框
# 创建子图
ax1 = fig.add_subplot(211)  # 等同 ax1 = plt.subplot(221)
ax2 = fig.add_subplot(223)
ax3 = fig.add_subplot(224)
设置子图的方式1:subplot()
matplotlib.pyplot.subplot(nrows, ncols, plot_number, axisbg, polar, projection)
- 绘图区分为nrows 行和ncols 列,从左到右、从上到下顺序对每个区域进行编号,左上区编号为1。
- nrows 表示图的行数,ncols 表示图的列数,plot_number 表示第几个子图。上述三个参数均小于10 时,中间逗号可以省略。
- axisbg=color,表示所选子图背景颜色。
- polar=False,是否为极地投影,默认为否。
- projection:使用指定的投影方式,该方式使用之前需要已经注册(registered)。

设置子图的方式2:subplot2grid()
matplotlib.pyplot.subplot2grid(shape, loc, rowspan=1, colspan=1, *kwargs) *在网格中创建subplot。
- 网格由shape 指定,如(3,4),表示3行4列。
- loc 指定位置,如:(0,0),表示(第1行,第1列)。(1,2),表示(第2行,第3列)。
- rowspan, colspan 生成行和列。rowspan表示占用几行,colspan表示占用几列。
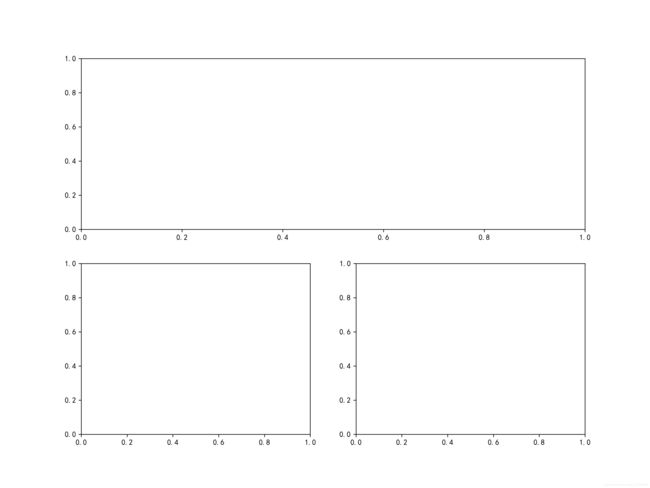
# 2行2列,位置从(0, 0)开始,占用1行,2列
ax1 = plt.subplot2grid(shape=(2, 2), loc=(0, 0), rowspan=1, colspan=2)
# 2行2列,位置从(1, 0)开始,占用1行,1列
ax2 = plt.subplot2grid(shape=(2, 2), loc=(1, 0), rowspan=1, colspan=1)
# 2行2列,位置从(1, 1)开始,占用1行,1列
ax3 = plt.subplot2grid(shape=(2, 2), loc=(1, 1), rowspan=1, colspan=1)
文字注释:text()
text(x, y, s, family, fontsize, style, color)
- x,y代表注释内容位置,
- s代表注释文本内容,
- family设置字体,自带的可选项有{‘serif’, ‘sans-serif’, ‘cursive’, ‘fantasy’, ‘monospace’},
- fontsize字体大小,
- style设置字体样式,可选项{‘normal’, ‘italic’(斜体), ‘oblique’(也是斜体)}
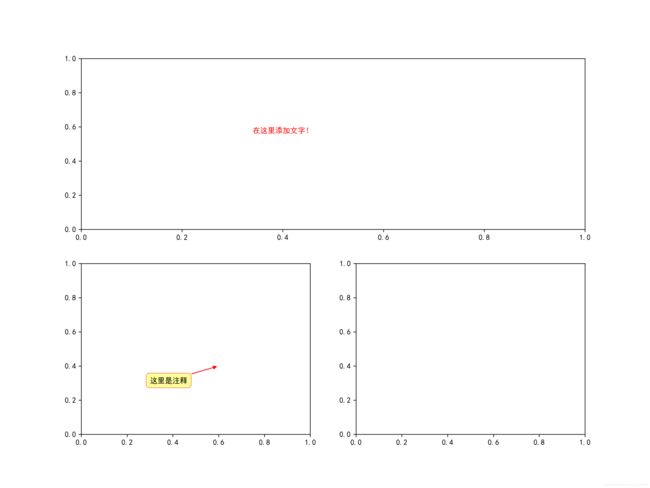
ax1.text(
    0.4,  # x坐标
    0.6,  # y坐标
    '在这里添加文字!',  # 字符串
    multialignment='left',  # 多行对齐方式
    ha='center',  # 左对齐   居中:center
    va='top',  # 顶部对齐
    fontsize=10,  # 字体大小
    wrap=True,  # 字体颜色
    color='red',  # 字体颜色
)

注释:matplotlib.pyplot.annotate()
text:str, 注释信息内容
- xy:(float,float), 箭头点所在的坐标位置
- xytext:(float,float), 注释内容的坐标位置
- weight: str or int, 设置字体线型,其中字符串从小到大可选项有: {‘ultralight’, ‘light’, ‘normal’, ‘regular’, ‘book’, ‘medium’, ‘roman’, ‘semibold’, ‘demibold’, ‘demi’, ‘bold’, ‘heavy’, ‘extra bold’, ‘black’}
- color: str or tuple, 设置字体颜色 ,单个字符候选项{‘b’, ‘g’, ‘r’, ‘c’, ‘m’, ‘y’, ‘k’, ‘w’}, 也可以’black’,‘red’等,tuple时用[0,1]之间的浮点型数据,RGB或者RGBA, 如: (0.1, 0.2, 0.5)、(0.1, 0.2, 0.5, 0.3)等
- arrowprops:dict,设置指向箭头的参数,字典中key值有①arrowstyle:设置箭头的样式, 其value候选项如’->’,’|-|’,’-|>’,也可以用字符串’simple’,‘fancy’等。
- connectionstyle:设置箭头的形状,为直线或者曲线,候选项有’arc3’,‘arc’,‘angle’,‘angle3’,可以防止箭头被曲线内容遮挡
- color:设置箭头颜色,见前面的color参数。
- bbox:dict,为注释文本添加边框,其key有boxstyle,其格式类似’round,pad=0.5’。
- facecolor(可简写为fc)设置背景颜色
- edgecolor(可简写为ec)设置边框线条颜色
- lineweight(可简写为lw)设置边框线型粗细
- alpha设置透明度,[0,1]之间的小数,0代表完全透明。
ax2.annotate(
    text='这里是注释',
    xy=(0.6, 0.4),  # 箭头点所在的坐标位置
    xytext=(0.3, 0.3),  # 注释内容的坐标位置
    weight='bold',
    color='black',
    arrowprops=dict(arrowstyle='-|>', connectionstyle='arc3', color='red'),
    bbox=dict(boxstyle='round,pad=0.5', fc='yellow', ec='red', lw=1, alpha=0.4))