seaborn 画堆叠柱状图_Seaborn-基于matplotlib的更强力制图库
相信大家在开始python的使用后,便随后接触到了matplotlib这个与python兼容的很好的制图库。但是,如果想把图做的更细,更上流,那么则需要seaborn这个库,比起matplotlib更容易上手,并且和pandas的两种主要数据结构Series和DataFrame有着很强的兼容性。
1 . 安装,工欲善其事,安装 seaborn,有两种方法。
pip install seaborn

conda install seaborn
在这里我用的conda的客户端版。
2. 对于seaborn的介绍,我们从最简单也是最常用的"柱状图"开始。
barplot便是seaborn库的柱状图方法。
seaborn2.1 数据集介绍
在这里我们使用seaborn自带的数据集tips。
import seaborn as sns
tips = sns.load_dataset("tips")
print(tips.head())

>>>
   total_bill   tip     sex smoker  day    time  size
0       16.99  1.01  Female     No  Sun  Dinner     2
1       10.34  1.66    Male     No  Sun  Dinner     3
2       21.01  3.50    Male     No  Sun  Dinner     3
3       23.68  3.31    Male     No  Sun  Dinner     2
4       24.59  3.61  Female     No  Sun  Dinner     4
Tips是Dataframe结构, 其矩阵为(244, 7),一共有244条数据,7个属性,分别为
- total_bill: 账单总额
- tip: 小费
- sex: 性别
- smoker: 是否抽烟
- day: 周几(周一 至 周日)
- time: 上午下午
- size: 人数
2.2 seaborn.barplot 方法使用以及参数介绍
2.2.1: 尝试 barplot
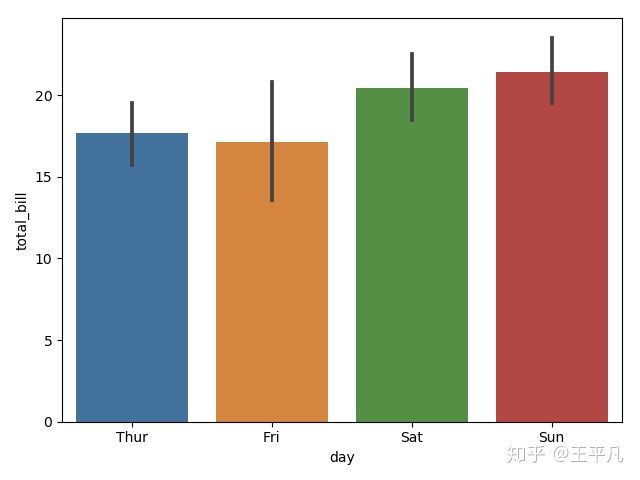
sns.barplot(x = 'day', y = 'total_bill', data = tips)
plt.show()
# 黑线表示置信区间(Confidence interval)横坐标:周几
纵坐标:账单金额
上图黑线为纵坐标数据的统计数据的
置信区间_百度百科baike.baidu.com,如果不改动的话默认为平均数。
2.2.2 使用 hue 分类每一列数据,按性别来分
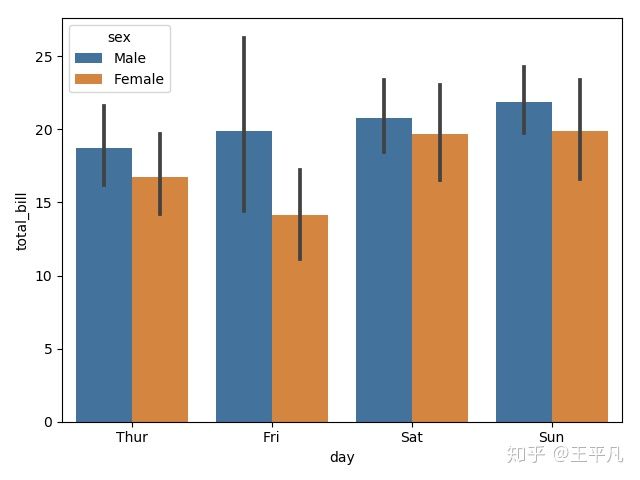
还是刚才的数据,将账单金额按男女性别划分开来,使用到参数 hue 。
sns.barplot(x = 'day', y = 'total_bill', hue= 'sex',data= tips)
plt.show()通过 hue 的设置,可以将图2.2.1按性别更加细化。
2.2.3 画一个horizontal (水平方向)的图
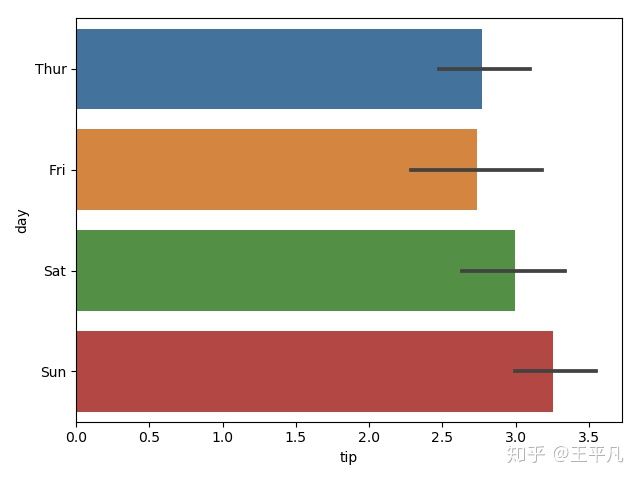
sns.barplot(x = 'tip', y = 'day', data=tips)
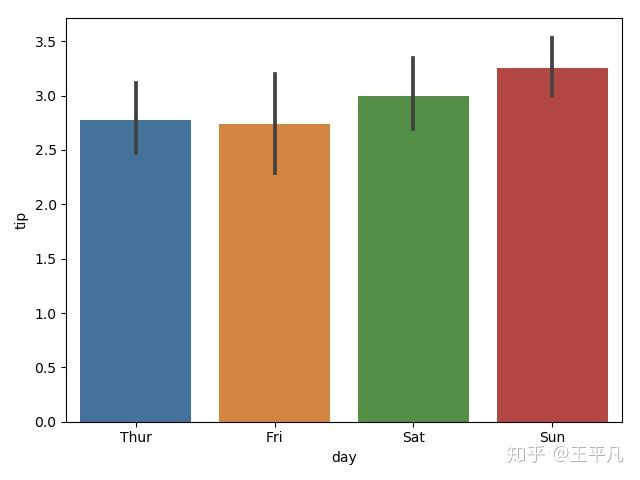
plt.show()在barplot 有一个参数为orient, 参数包括 ’v' 和‘h’ ,分别对应垂直方向和水平方向,也可以通过这个函数将图转化为水平或者竖直方向。
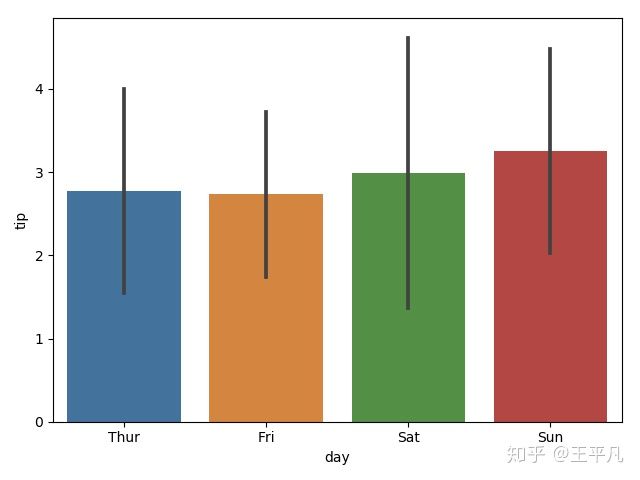
sns.barplot(x = 'day', y = 'tip', data = tips, orient='v')
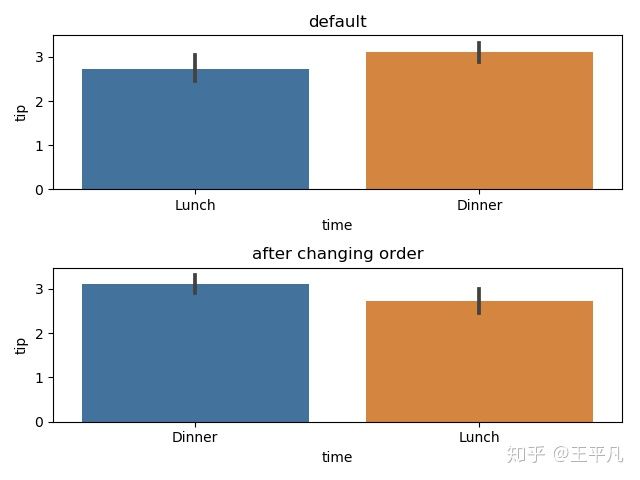
plt.show()2.2.4 显性的控制bar的排列, 每一列的排序是默认的,但是可以通过参数 order 进行修改
fig = plt.figure()
ax1 = fig.add_subplot(2,1,1)
ax2 = fig.add_subplot(2,1,2)
ax1.set_title("default")
ax2.set_title("after changing order")

sns.barplot(x='time', y = 'tip', data=tips, ax = ax1)
# lunch, dinner
sns.barplot(x='time', y = 'tip', data=tips, order=['Dinner', 'Lunch'], ax = ax2)
# become Dinner, lunch
plt.show()
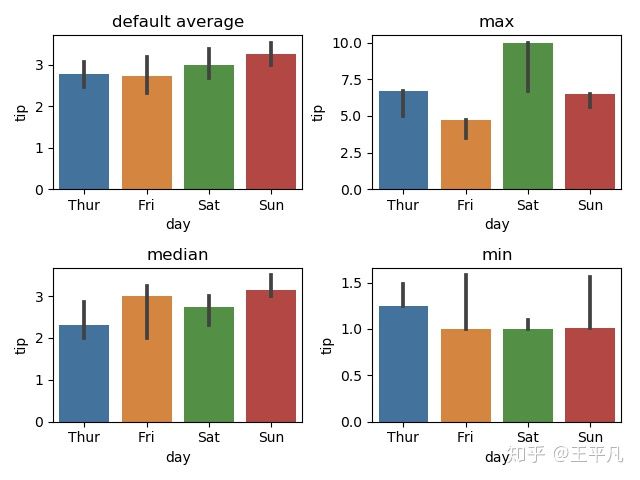
2.2.5 通过修改 estimator 调整统计方式
estimator 可以引用 numpy中的方法,例如max, min, median等。更多的方法可以参考
Statistics - NumPy v1.17 Manualdocs.scipy.orgfrom numpy import median, max, min
fig = plt.figure()
ax1 = fig.add_subplot(2,2,1)
ax2 = fig.add_subplot(2,2,2)
ax3 = fig.add_subplot(2,2,3)
ax4 = fig.add_subplot(2,2,4)
ax1.set_title('default average')
ax2.set_title('max')
ax3.set_title('median')
ax4.set_title('min')
sns.barplot(x="day", y="tip", data=tips, ax = ax1)
sns.barplot(x="day", y="tip", data=tips, estimator= max, ax = ax2)
sns.barplot(x="day", y="tip", data=tips, estimator= median, ax = ax3)
sns.barplot(x="day", y="tip", data=tips, estimator= min, ax = ax4)
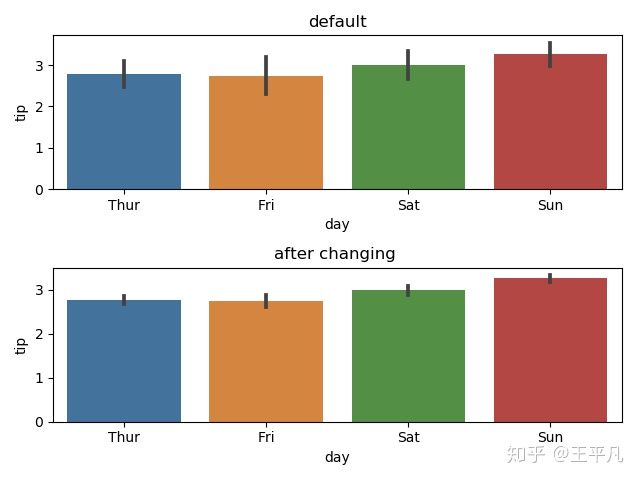
plt.show()2.2.6 通过修改 ci 调整置信区间的大小,默认为95%
fig = plt.figure()
ax1 = fig.add_subplot(2,1,1)
ax2 = fig.add_subplot(2,1,2)
ax1.set_title("default")
ax2.set_title("after changing ")

sns.barplot(x="day", y="tip", data=tips,ax = ax1)
sns.barplot(x="day", y="tip", data=tips, ci=45, ax = ax2)
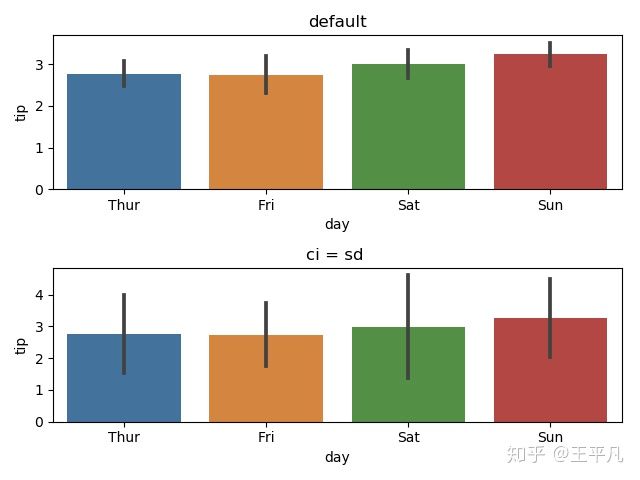
plt.show()2.2.7 ci 还有一个特殊的参数 ci = sd, 则直接使用标准差(standard deviation)进行统计
fig = plt.figure()
ax1 = fig.add_subplot(2,1,1)
ax2 = fig.add_subplot(2,1,2)
ax1.set_title("default")
ax2.set_title("ci = sd ")
sns.barplot(x="day", y="tip", data=tips,ax = ax1)
sns.barplot(x="day", y="tip", data=tips, ci='sd', ax = ax2)
plt.show()
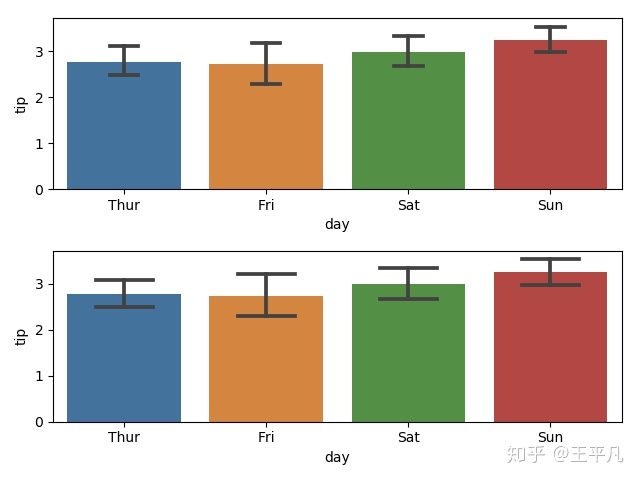
2.2.8 通过 capsize 调整 ”帽子宽度“, 默认是 None
fig = plt.figure()
ax1 = fig.add_subplot(2,1,1)
ax2 = fig.add_subplot(2,1,2)
sns.barplot(x="day", y="tip", data=tips, capsize= 0.2, ax = ax1)
sns.barplot(x="day", y="tip", data=tips, capsize= 0.4, ax = ax2)
plt.show()
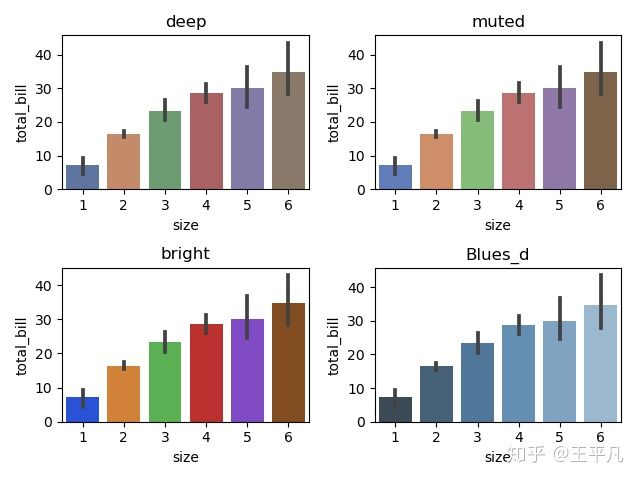
2.2.9 调整 palette 换一种其他的颜色调色板
可用的参数可以看
seaborn.color_palette - seaborn 0.10.1 documentationseaborn.pydata.org着这里只举几个常用的例子
fig = plt.figure()
ax1 = fig.add_subplot(2,2,1)
ax2 = fig.add_subplot(2,2,2)
ax3 = fig.add_subplot(2,2,3)
ax4 = fig.add_subplot(2,2,4)
ax1.set_title("deep")
ax2.set_title('muted')
ax3.set_title('bright')
ax4.set_title('Blues_d')
sns.barplot("size", y="total_bill", data=tips, palette="deep", ax = ax1)
sns.barplot("size", y="total_bill", data=tips, palette="muted", ax = ax2)
sns.barplot("size", y="total_bill", data=tips, palette="bright", ax = ax3)
sns.barplot("size", y="total_bill", data=tips, palette="Blues_d", ax = ax4)
plt.show()
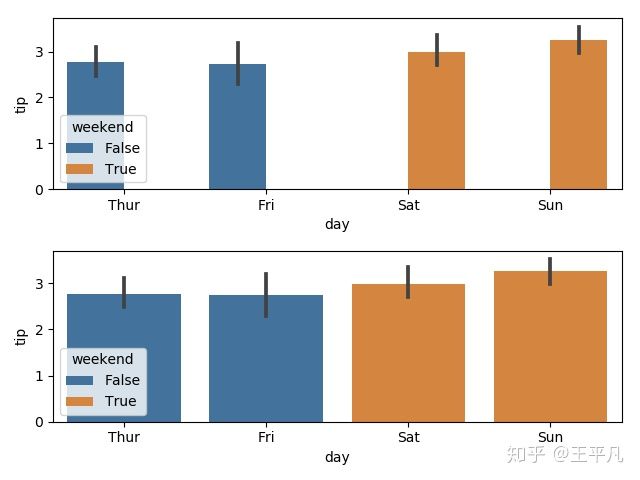
2.2.9 hue 的进一步使用
fig = plt.figure()
ax1 = fig.add_subplot(2,1,1)
ax2 = fig.add_subplot(2,1,2)
tips['weekend'] = tips['day'].isin(['Sat','Sun'])
sns.barplot(x='day', y='tip', data=tips, hue='weekend', ax = ax1)
sns.barplot(x='day', y='tip', data=tips, hue='weekend', dodge=False, ax = ax2)
plt.show()
默认的hue使用后造成不美观的现象,使用 dodge=False 可以将空白补齐。
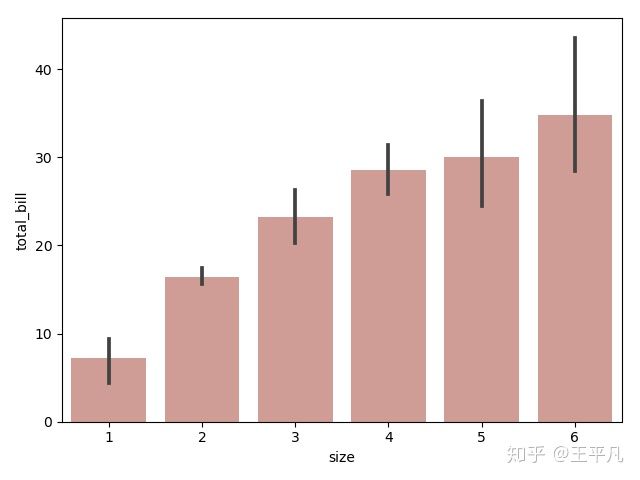
2.2.10 颜色的精细化调整, color 和 saturation(饱和度)的使用
ax = sns.barplot("size", y="total_bill", data=tips,
                 color="salmon", saturation=.5)
plt.show()
总结,我们将barplot基本的常用参数都演示了一遍,当然seaborn还有直方图和散点图等工具。
可以关注我的公众号 : 平凡的科研生活,同时也会有其他的数据分析相关的文章分享。
