matplotlib之pyplot模块--python绘图
文章目录
- matplotlib之pyplot模块--python绘图
-
- 导入包
- 坐标轴
- 图标
matplotlib之pyplot模块–python绘图
导入包
import matplotlib.pyplot as plt
坐标轴
通过xlim()和ylim()函数来设置坐标轴范围
plt.xlim((-5, 5))
plt.ylim((-2, 2))
通过xlim()和ylim()函数来设置坐标轴名称、字体、大小
plt.xlabel('x轴', fontdict={'family': 'SimHei', 'size': 30})
plt.ylabel('y轴', fontdict={'family': 'SimHei', 'size': 30})
通过xticks()和yticks()函数来设置坐标轴刻度、字体、大小
plt.xticks(np.arange(-5, 5, 0.5),fontproperties = 'Times New Roman', size = 10)
plt.yticks(np.arange(-2, 2, 0.3),fontproperties = 'Times New Roman', size = 10)
通过rcParams模块来调整刻度的方向:in、out、inout依此表示刻度朝内,外和内外兼有默认为out
plt.rcParams['xtick.direction'] = 'in'
plt.rcParams['ytick.direction'] = 'in'
以上代码就是控制坐标轴刻度线的朝向,但是要放在画图的前面,否则会失效。
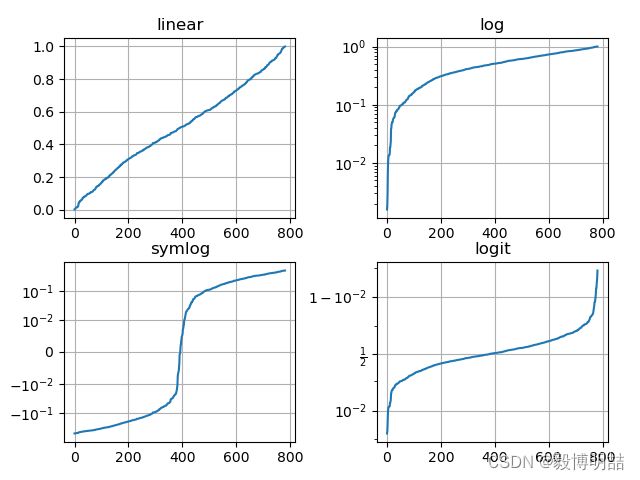
xscale()和yscale()函数的作用都是设置坐标轴的缩放类型,其中缩放类型取值范围为{"linear", "log", "symlog", "logit", ...}默认为linear
import matplotlib.pyplot as plt
import numpy as np

np.random.seed(19880801)

# 构造数据,要求数据都在0-1之间,否则不能设置logit缩放类型
y = np.random.normal(loc=0.5, scale=0.4, size=1000)
y = y[(y > 0) & (y < 1)]
y.sort()
x = np.arange(len(y))


# linear,默认缩放类型
plt.subplot(221)
plt.plot(x, y)
plt.yscale('linear')
plt.title('linear')
plt.grid(True)

# log
plt.subplot(222)
plt.plot(x, y)
plt.yscale('log')
plt.title('log')
plt.grid(True)

# symmetric log
plt.subplot(223)
plt.plot(x, y - y.mean())
plt.yscale('symlog', linthresh=0.01)
plt.title('symlog')
plt.grid(True)

# logit
plt.subplot(224)
plt.plot(x, y)
plt.yscale('logit')
plt.title('logit')
plt.grid(True)

plt.subplots_adjust(top=0.92, bottom=0.08, left=0.10, right=0.95, hspace=0.25,
                    wspace=0.35)

plt.show()
解决中文乱码问题
plt.rcParams['font.sans-serif'] = ['SimHei']
图标
通过title()函数来设置标题、字体、大小
plt.title('图标题', fontdict={'family': 'SimHei', 'size': 30})
通过legend()函数来设置图例、位置、字体、大小
plt.legend(loc="lower left", prop={'family': 'Times New Roman', 'size': 26})
Legend()参数调整图例位置
matplotlib.pyplot.legend(loc='String' or Number, bbox_to_anchor=(num1, num2))
- 1.loc参数的具体使用情况如下:
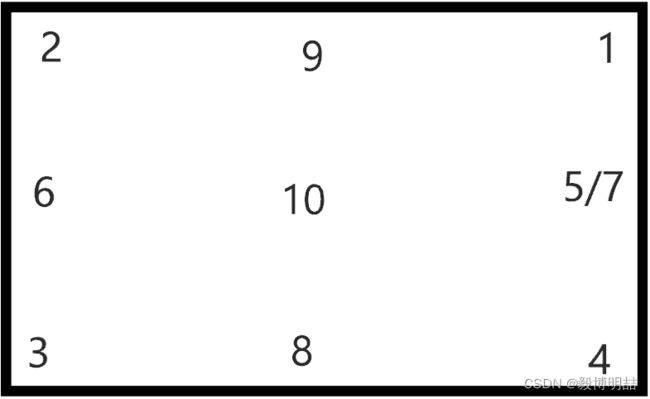
String由两个单词拼合而成,第一个单词为upper/center/lower,用于描述摆放位置的上/中/下,第二个单词为left/center/right,用于描述摆放位置的左/中/右,例如右上,即为upper right。对应的有Number参数与之对应,具体请看下文:
注:loc参数用于大致调整图例位置。
| 位置 | String | |
|---|---|---|
| 右上 | upper right | 1 |
| 左上 | upper left | 2 |
| 左下 | lower left | 3 |
| 右下 | lower right | 4 |
| 正右 | right | 5 |
| 中央偏左 | center left | 6 |
| 中央偏右 | center right | 7 |
| 中央偏下 | lower center | 8 |
| 中央偏上 | upper center | 9 |
| 正中央 | center | 10 |
具体在图中的位置见下图:
- 2.bbox_to_anchor参数的使用情况如下:
bbox_to_anchor被赋予的二元组中,num1用于控制legend的左右移动,值越大越向右边移动,num2用于控制legend的上下移动,值越大,越向上移动。
注:bbox_to_anchor参数用于微调图例位置。
图片存储与展示
plt.savefig(out_path) # 存储单图,out_path:保存图像的路径,即图片的位置及名称格式。
plt.show()    #图片展示
save_image(fake_images, './img/fake_images-{}.png'.format(epoch + 1))
plt.savefig('./img/pic-{}.png'.format(epoch + 1)) # 存储多张图片
lt.show() #图片展示
save_image(fake_images, ‘./img/fake_images-{}.png’.format(epoch + 1))
plt.savefig(‘./img/pic-{}.png’.format(epoch + 1)) # 存储多张图片

