%% 1.清空环境变量和命令
clear all %清除Workspace 工作区所有变量
clc %清除命令行所有命令
%% 2.变量命名规则
% 长度不能超过63位,字母开头

% 2.字符与字符串
s='a'
abs(s)
char(65)
num2str(65)
str='I Love MATLAB & Machine Learning.'
length(str)

% 3.矩阵
A = [1 2 3; 4 5 2; 3 2 7]
B=A' % 行列转置
C=A(:) % 遍历输出所有元素
C=A(:,1) % 遍历第三列,从1开始
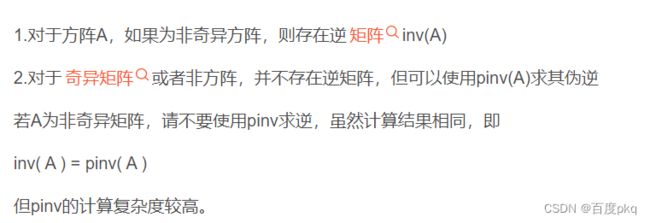
D=inv(A)% 逆矩阵满足性质 AB=BA=E (E是单位阵)
A*D % 结果为单位矩阵

E=zeros(10,5,3)%10*5行3个的三维矩阵
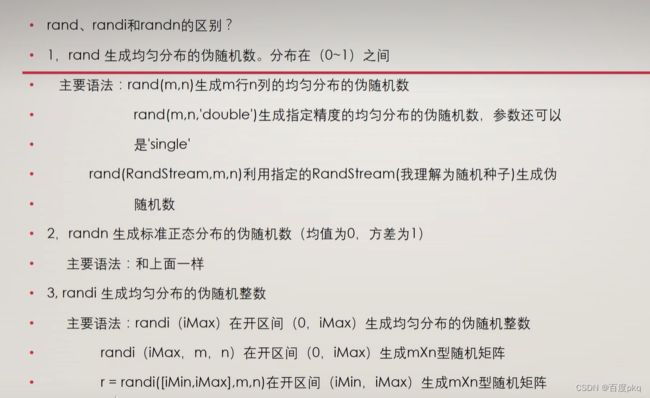
E(:, :,1)=rand(10,5) %
E(:, :,2)=randi(5,10,5)%
E(:,:,3)=randn(10,5)%
%% 元胞数组和结构体
% 元胞数组
A =cell(1,6)
A{2}=eye(0)%单位矩阵 下标从1开始
A{5}=magic(5)
B=A{5}

B =
17    24     1     8    15
23     5     7    14    16
 4     6    13    20    22
10    12    19    21     3
11    18    25     2     9
% 5.结构体 python的字典
books=struct('name', {{'Machine Learning', ' Data Mining' } }, 'price',[30 40])
books.name
books.name(1) % 结果是cell
books.name{1} % 结果是字符串

% 1.矩阵的定义与构造
A=[ 1 2 3 5 6 7 5 3]
B=1:2:8 %1到8的等差数列,2不可缺省
C=repmat(B,3,1)%将B重复行3次,列1次 总大小(3,4)
D=ones(2,4)


% 2.矩阵的四则运算
A=[1 2 3 4; 5 6 7 8]
B=[1 1 2 2;2 2 1 1]
C=A +B
D=A- B
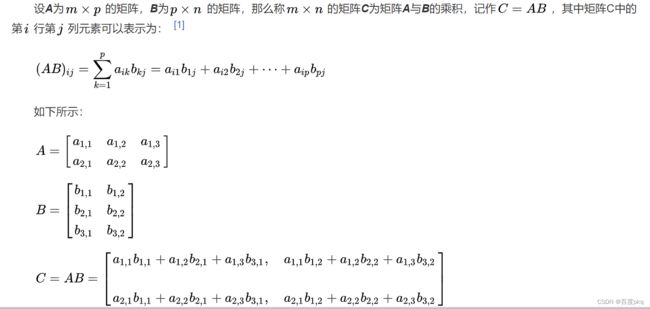
E1=A*B % 错误,(2,4)*(2,4)前行和后列不相等,无法相乘
E=A* B'
F=A .* B % 对应项相乘
G=A/B  % A*B的逆G*B= A G *B* pinv(B) = A * pinv(B) G = A * pinv(B)
H=A ./ B %对应项逆
%% 循环控制
sum=0
for i=1:9
    i*i
    sum=sum+i^2;
end

%求1-5的阶乘
sum=0
for i=1:5
    p=1;
    for j=1:i
        if(i~=5) % ~= 不等于
            p=p*j;
        end
    end
    switch (i)
        case 1
            disp(1)
        otherwise
            disp("我是sb")
    end
    sum=sum+p
end

%% VII. MATLAB基本绘图操作%%
% 1.二维平面绘图
x = 0:0.01:2*pi ;
y = sin(x);
figure %建立一个画布
plot(x, y)
title('y = sin(x)')
xlabel('x')
ylabel('sin(x)')
xlim([0 2*pi])


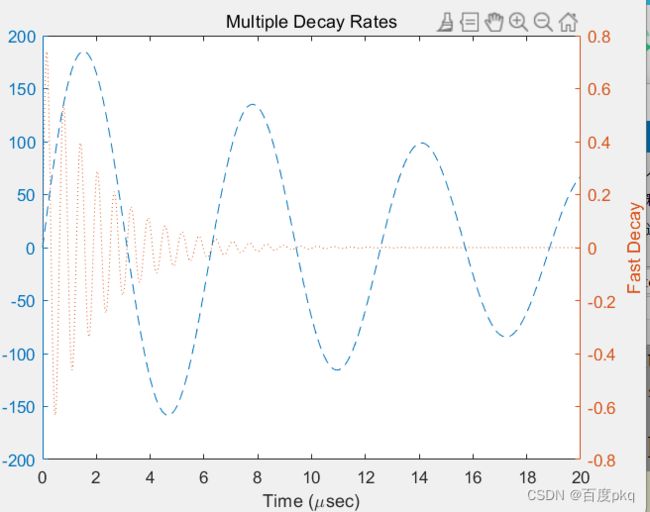
x= 0:0.01:20;
y1 = 200*exp (-0.05*x).*sin(x);y2 =0.8*exp (-0.5*x).*sin(10*x);figure
[AX, H1, H2] = plotyy(x, y1,x, y2,'plot') ;
set(get(AX(1), 'Ylabel'), 'String', 'Slow Decay')
set(get (AX(2),'Ylabel'), 'String', 'Fast Decay')
xlabel('Time (\musec)')
title('Multiple Decay Rates')
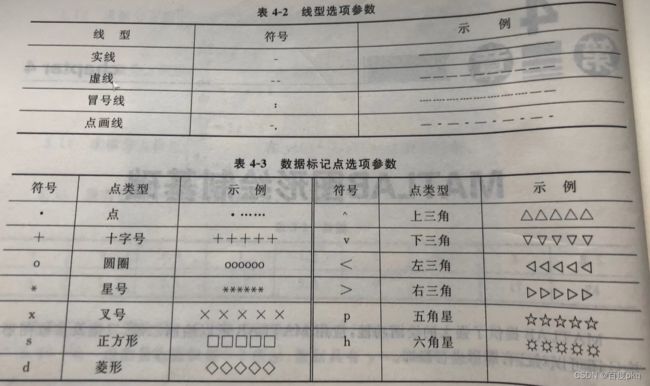
set(H1, 'LineStyle','--')
set(H2,'LineStyle',':')
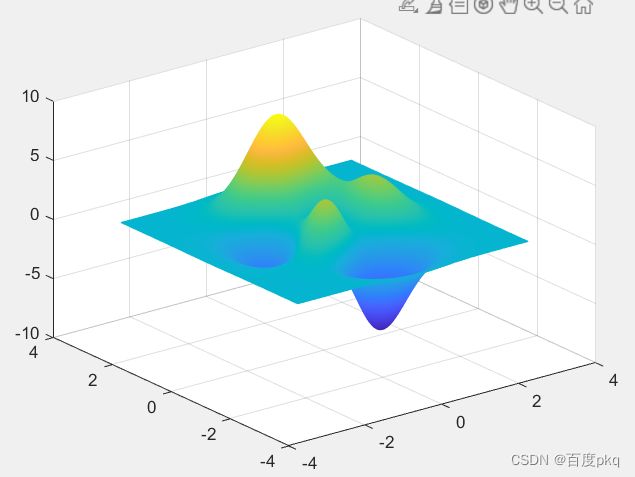
[x,y,z] =peaks(399)
mesh(x,y,z)
grid on
