完美解决共线性数据的问题
import numpy as np
import pandas as pd
import matplotlib.pyplot as plt
import statsmodels.api as sm
import statsmodels.stats.outliers_influence
from statsmodels.stats.outliers_influence import variance_inflation_factor
Ols
data=pd.read_csv("C:/Users/可乐怪/Desktop/线性回归2021/linear2021.csv")
data.insert(4,'constant',1)
model=sm.OLS(data['y'],data.iloc[:,:5]).fit()
print(model.summary())
                            OLS Regression Results
==============================================================================
Dep. Variable:                      y   R-squared:                       0.542
Model:                            OLS   Adj. R-squared:                  0.501
Method:                 Least Squares   F-statistic:                     13.32
Date:                Wed, 22 Dec 2021   Prob (F-statistic):           3.07e-07
Time:                        13:22:25   Log-Likelihood:                -64.548
No. Observations:                  50   AIC:                             139.1
Df Residuals:                      45   BIC:                             148.7
Df Model:                           4
Covariance Type:            nonrobust
==============================================================================
                 coef    std err          t      P>|t|      [0.025      0.975]
------------------------------------------------------------------------------
x1             0.7096      0.469      1.513      0.137      -0.235       1.654
x2             0.5776      1.498      0.386      0.702      -2.439       3.594
x3             0.6079      1.476      0.412      0.682      -2.365       3.581
x4             1.0829      0.271      3.995      0.000       0.537       1.629
constant       2.6947      0.620      4.348      0.000       1.447       3.943
==============================================================================
Omnibus:                        0.050   Durbin-Watson:                   1.891
Prob(Omnibus):                  0.975   Jarque-Bera (JB):                0.229
Skew:                          -0.041   Prob(JB):                        0.892
Kurtosis:                       2.679   Cond. No.                         42.7
==============================================================================
VIF>10,存在多共线性
from statsmodels.stats.outliers_influence import variance_inflation_factor
vif=[]
for i in range(4):
    a=round(variance_inflation_factor(data.iloc[:,:5].values,i),2)
    vif.insert(i,a)
print(vif)
[10.42, 30.38, 36.02, 1.08]
Ridge 回归
标准化数据做回归
data_scale=pd.DataFrame()
from sklearn import preprocessing
data_scale['y'] =preprocessing.scale(data['y'])
data_scale['x1'] =preprocessing.scale(data['x1'])
data_scale['x2'] =preprocessing.scale(data['x2'])
data_scale['x3'] =preprocessing.scale(data['x3'])
data_scale['x4']=preprocessing.scale(data['x4'])
data_scale.insert(1,'constant',1)
model2=sm.OLS(data_scale['y'],data_scale.iloc[:,2:]).fit()
print(model2.summary())
                                 OLS Regression Results
=======================================================================================
Dep. Variable:                      y   R-squared (uncentered):                   0.542
Model:                            OLS   Adj. R-squared (uncentered):              0.502
Method:                 Least Squares   F-statistic:                              13.62
Date:                Wed, 22 Dec 2021   Prob (F-statistic):                    2.12e-07
Time:                        13:51:57   Log-Likelihood:                         -51.417
No. Observations:                  50   AIC:                                      110.8
Df Residuals:                      46   BIC:                                      118.5
Df Model:                           4
Covariance Type:            nonrobust
==============================================================================
                 coef    std err          t      P>|t|      [0.025      0.975]
------------------------------------------------------------------------------
x1             0.4926      0.322      1.530      0.133      -0.156       1.141
x2             0.2144      0.550      0.390      0.698      -0.893       1.321
x3             0.2493      0.599      0.416      0.679      -0.956       1.454
x4             0.4191      0.104      4.039      0.000       0.210       0.628
==============================================================================
Omnibus:                        0.050   Durbin-Watson:                   1.891
Prob(Omnibus):                  0.975   Jarque-Bera (JB):                0.229
Skew:                          -0.041   Prob(JB):                        0.892
Kurtosis:                       2.679   Cond. No.                         12.2
==============================================================================
from sklearn.linear_model import Ridge
k=np.linspace(0,1,100)#(start, end, num=num_points)使k属于[0,1]
y=data_scale['y']
x=data_scale.iloc[:,2:]
θ1=[]
θ2=[]
θ3=[]
θ4=[]

for  i  in range(len(k)):
    ridge = Ridge(k[i])
    ridge =ridge .fit(x, y)
    θ1.append(ridge.coef_[0])
    θ2.append(ridge.coef_[1])
    θ3.append(ridge.coef_[2])
    θ4.append(ridge.coef_[3])

plt.plot(k,θ1,'r',alpha=0.5,)
plt.plot(k,θ2,'b-.',alpha=0.5)
plt.plot(k,θ3,'y+')
plt.plot(k,θ4,'m+')
plt.xlabel('k',size=15)
plt.ylabel('θj(k)',size=15)
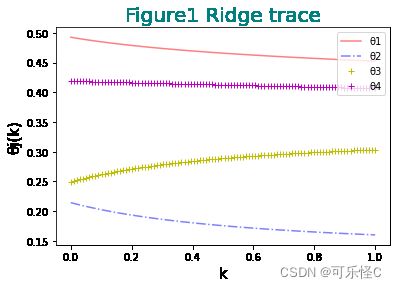
plt.legend(['θ1', 'θ2', 'θ3','θ4'], loc='upper right')
plt.title('Figure1 Ridge trace',size=20,c='teal')
plt.show()
由Ridge trace可知去除x2然后做回归
model2=sm.OLS(data['y'],data[['x1','x4','x3']]).fit()
print(model2.summary())
                                 OLS Regression Results
=======================================================================================
Dep. Variable:                      y   R-squared (uncentered):                   0.968
Model:                            OLS   Adj. R-squared (uncentered):              0.966
Method:                 Least Squares   F-statistic:                              480.7
Date:                Wed, 22 Dec 2021   Prob (F-statistic):                    2.94e-35
Time:                        14:01:26   Log-Likelihood:                         -73.676
No. Observations:                  50   AIC:                                      153.4
Df Residuals:                      47   BIC:                                      159.1
Df Model:                           3
Covariance Type:            nonrobust
==============================================================================
                 coef    std err          t      P>|t|      [0.025      0.975]
------------------------------------------------------------------------------
x1             0.5201      0.191      2.725      0.009       0.136       0.904
x4             2.1311      0.151     14.160      0.000       1.828       2.434
x3             1.7593      0.277      6.362      0.000       1.203       2.316
==============================================================================
Omnibus:                        0.426   Durbin-Watson:                   2.274
Prob(Omnibus):                  0.808   Jarque-Bera (JB):                0.584
Skew:                          -0.110   Prob(JB):                        0.747
Kurtosis:                       2.518   Cond. No.                         4.63
==============================================================================
拟合完美R^2=0.968
数据文件
链接:https://pan.baidu.com/s/12rI3jTX0cQ6UQu_R1jQpDA
提取码:hd5k
