python数据可视化01
一.什么是数据可视化
数据可视化是将数据以视觉形式表现出来的数据研究。也可以理解为是通过计算机图形学和图像处理等技术将获取的数据转换成图表或图像等展现在屏幕上,并进行各种交互处理的理论、方法和技术。
二.使用matplotilib绘制图表
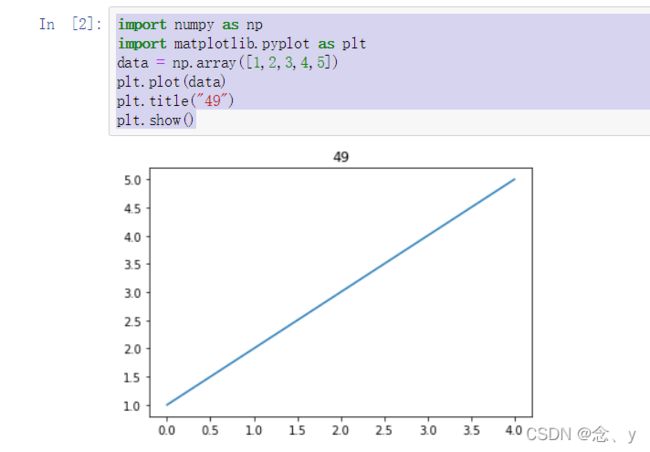
import numpy as np
import matplotlib.pyplot as plt
data = np.array([1,2,3,4,5])
plt.plot(data)
plt.title("49")
plt.show()
三.使用plot()绘制折线图
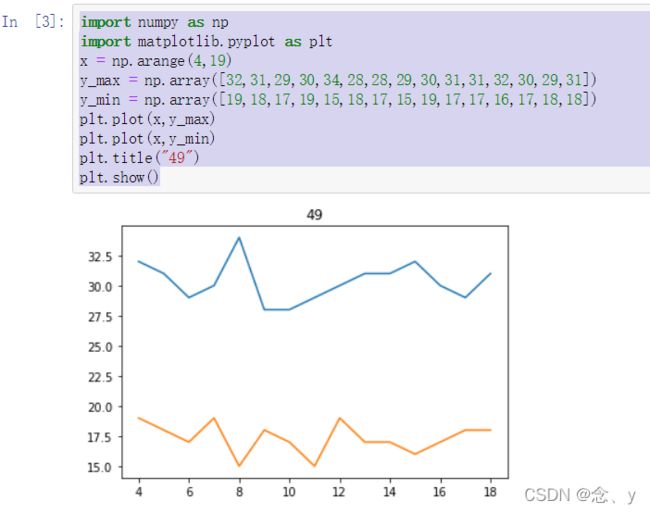
import numpy as np
import matplotlib.pyplot as plt
x = np.arange(4,19)
y_max = np.array([32,31,29,30,34,28,28,29,30,31,31,32,30,29,31])
y_min = np.array([19,18,17,19,15,18,17,15,19,17,17,16,17,18,18])
plt.plot(x,y_max)
plt.plot(x,y_min)
plt.title("49")
plt.show()
四.使用bar()绘制柱形图或堆积柱形图
import numpy as np
import matplotlib.pyplot as plt
x = np.arange(5)
y1 = np.array([10,9,8,7,6])
bar_width = 0.3
plt.bar(x,y1, tick_label=['a','b','c','d','e'], width=bar_width)
plt.title("49")
plt.show()

import numpy as np
import matplotlib.pyplot as plt
x = np.arange(5)
y1 = np.array([10,9,8,7,6])
y2 = np.array([6,7,8,9,10])
bar_width = 0.3
plt.bar(x,y1, tick_label=['a','b','c','d','e'], width=bar_width)
plt.bar(x+bar_width, y2, width=bar_width)
plt.title("49")
plt.show()

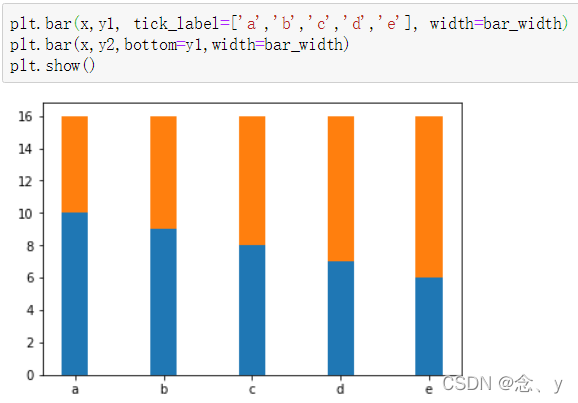
plt.bar(x,y1, tick_label=['a','b','c','d','e'], width=bar_width)
plt.bar(x,y2,bottom=y1,width=bar_width)
plt.show()
五.使用barh()绘制条形图或堆积条形图
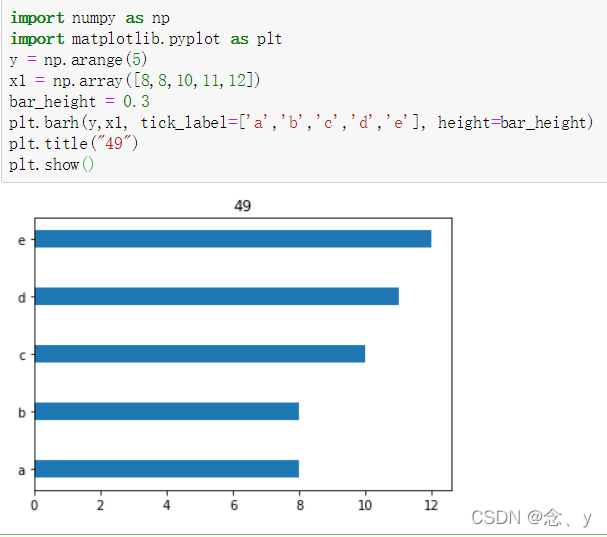
import numpy as np
import matplotlib.pyplot as plt
y = np.arange(5)
x1 = np.array([8,8,10,11,12])
bar_height = 0.3
plt.barh(y,x1, tick_label=['a','b','c','d','e'], height=bar_height)
plt.title("49")
plt.show()
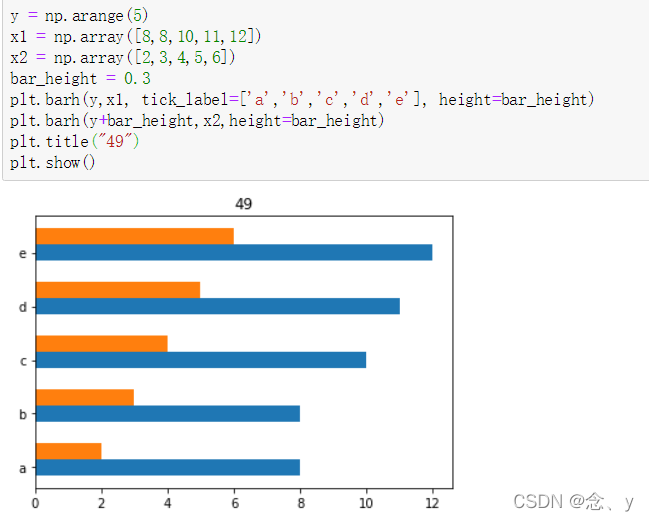
y = np.arange(5)
x1 = np.array([8,8,10,11,12])
x2 = np.array([2,3,4,5,6])
bar_height = 0.3
plt.barh(y,x1, tick_label=['a','b','c','d','e'], height=bar_height)
plt.barh(y+bar_height,x2,height=bar_height)
plt.title("49")
plt.show()
plt.barh(y,x1, tick_label=['a','b','c','d','e'], height=bar_height)
plt.barh(y,x2,left=x1,height=bar_height)
plt.title("49")
plt.show()
