Python使用技巧(一):matplotlib可视化动态图
import math
import random
import numpy as np
import matplotlib
import matplotlib.pyplot as plt
%matplotlib inline

# set up matplotlib
is_ipython = 'inline' in matplotlib.get_backend()
if is_ipython:
    from IPython import display

plt.ion()

def plot_durations(y):
    plt.figure(2)
    plt.clf()
    plt.subplot(211)
    plt.plot(y[:,0])
    plt.subplot(212)
    plt.plot(y[:,1])

    plt.pause(0.001)  # pause a bit so that plots are updated
    if is_ipython:
        display.clear_output(wait=True)
        display.display(plt.gcf())

x = np.linspace(-10,10,500)
y = []
for i in range(len(x)):
    y1 = np.cos(i/(3*3.14))
    y2 = np.sin(i/(3*3.14))
    y.append(np.array([y1,y2])) #保存历史数据
    plot_durations(np.array(y))
import matplotlib.pyplot as plt

ax = []                    # 定义一个 x 轴的空列表用来接收动态的数据
ay = []                    # 定义一个 y 轴的空列表用来接收动态的数据
plt.ion()                  # 开启一个画图的窗口
for i in range(100):       # 遍历0-99的值
	ax.append(i)           # 添加 i 到 x 轴的数据中
	ay.append(i**2)        # 添加 i 的平方到 y 轴的数据中
	plt.clf()              # 清除之前画的图
	plt.plot(ax,ay)        # 画出当前 ax 列表和 ay 列表中的值的图形
	plt.pause(0.1)         # 暂停一秒
	plt.ioff()             # 关闭画图的窗口
import math
import random
import numpy as np
import matplotlib
import matplotlib.pyplot as plt
# % matplotlib
# inline

# set up matplotlib
is_ipython = 'inline' in matplotlib.get_backend()
if is_ipython:
    from IPython import display

plt.ion()


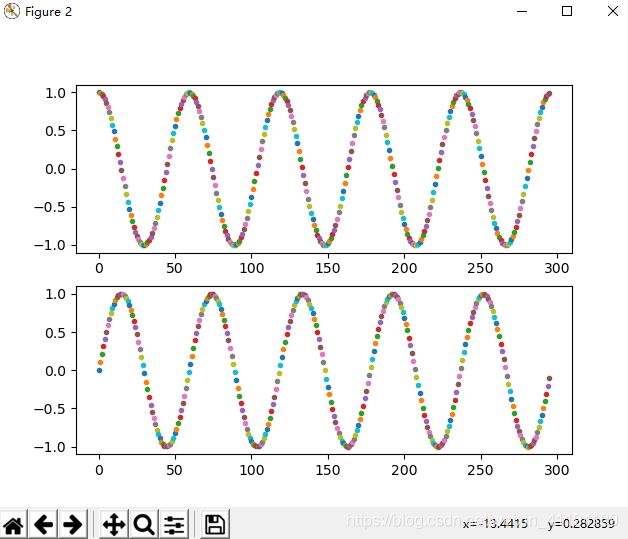
def plot_durations(i, y1, y2):
    plt.figure(2)
    #     plt.clf() 此时不能调用此函数,不然之前的点将被清空。
    plt.subplot(211)
    plt.plot(i, y1, '.')
    plt.subplot(212)
    plt.plot(i, y2, '.')

    plt.pause(0.001)  # pause a bit so that plots are updated
    if is_ipython:
        display.clear_output(wait=True)
        display.display(plt.gcf())


x = np.linspace(-10, 10, 500)
y = []
for i in range(len(x)):
    y1 = np.cos(i / (3 * 3.14))
    y2 = np.sin(i / (3 * 3.14))
    #     y.append(np.array([y1,y2])) #保存历史数据
    plot_durations(i, y1, y2)
import math
import numpy as np
import matplotlib.pyplot as plt
from mpl_toolkits.mplot3d import Axes3D  # 空间三维画图

# 数据
data = np.arange(24).reshape((8, 3))
x = data[:, 0]  # [ 0  3  6  9 12 15 18 21]
y = data[:, 1]*np.sin(x)  # [ 1  4  7 10 13 16 19 22]
z = data[:, 2]*np.cos(x)  # [ 2  5  8 11 14 17 20 23]

# 绘制散点图
fig = plt.figure()
ax = Axes3D(fig)
ax.scatter(x, y, z)

# 添加坐标轴(顺序是Z, Y, X)
ax.set_zlabel('Z', fontdict={'size': 15, 'color': 'red'})
ax.set_ylabel('Y', fontdict={'size': 15, 'color': 'red'})
ax.set_xlabel('X', fontdict={'size': 15, 'color': 'red'})
plt.show()
import math
import random
import numpy as np
import matplotlib
import matplotlib.pyplot as plt
# %matplotlib inline

# set up matplotlib
is_ipython = 'inline' in matplotlib.get_backend()
if is_ipython:
    from IPython import display

plt.ion()

def plot_durations(y1, y2):
    plt.figure(2)
#     plt.clf()
    plt.subplot(211)
    plt.plot(x, y1)
    plt.subplot(212)
    plt.plot(x, y2)

    plt.pause(0.001)  # pause a bit so that plots are updated
    if is_ipython:
        display.clear_output(wait=True)
        display.display(plt.gcf())


x = np.linspace(-10,10,500)
for i in range(100):
    y1 = np.cos(x*i/(3*3.14))
    y2 = np.sin(x*i/(3*3.14))
    plot_durations(y1, y2)
# -*- coding: utf-8 -*-

from matplotlib import pyplot as plt
from matplotlib import animation
import numpy as np

class Particle:
    def __init__(self, x, y, ang_vel):
        self.x = x
        self.y = y
        self.ang_vel = ang_vel

class ParticleSimulator:
    def __init__(self, particles):
        self.particles = particles

    def evolve(self, dt):
        timestep = 0.00001
        nsteps = int(dt / timestep)

        for i in range(nsteps):
            for p in self.particles:
                norm = (p.x **2 + p.y ** 2) ** 0.5
                v_x = -p.y / norm
                v_y = p.x / norm

                d_x = timestep * p.ang_vel * v_x
                d_y = timestep * p.ang_vel * v_y

                p.x += d_x
                p.y += d_y


def visualize(simulator):
    X = [p.x for p in simulator.particles]
    Y = [p.y for p in simulator.particles]

    fig = plt.figure()
    ax = plt.subplot(111, aspect = 'equal')
    line, = ax.plot(X, Y, 'ro')

    plt.xlim(-1, 1)
    plt.ylim(-1, 1)

    def init():
        line.set_data([], [])
        return line,

    def init2():
        line.set_data([], [])
        return line

    def animate(aa):
        simulator.evolve(0.01)
        X = [p.x for p in simulator.particles]
        Y = [p.y for p in simulator.particles]

        line.set_data(X, Y)
        return line,

    anim = animation.FuncAnimation(fig,
                                   animate,
                                   frames=10,
                                   init_func = init,
                                   blit = True,
                                   interval = 10)
    plt.show()


def test_visualize():
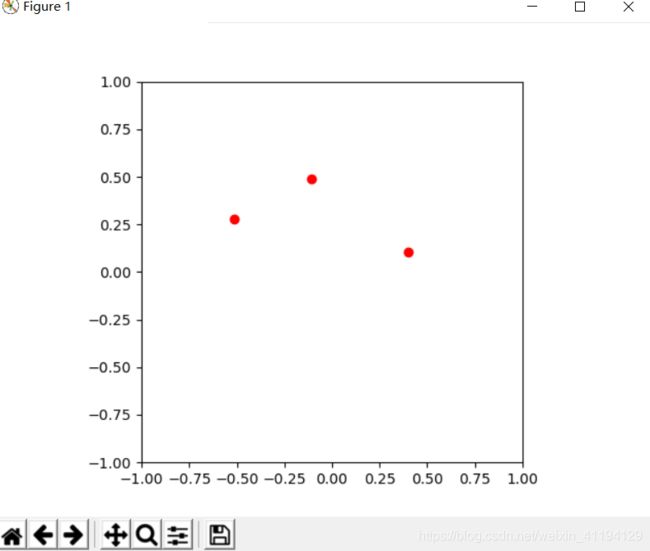
    particles = [Particle(0.3, 0.5, 1),
                 Particle(0.0, -0.5, -1),
                 Particle(-0.1, -0.4, 3)]
    simulator = ParticleSimulator(particles)
    visualize(simulator)

if __name__ == '__main__':
    test_visualize()
import numpy as np
import matplotlib
import matplotlib.pyplot as plt
import matplotlib.animation as animation


def update_points(num):
    point_ani.set_data(x[num], y[num])
    return point_ani,


x = np.linspace(0, 2 * np.pi, 100)
y = np.sin(x)

fig = plt.figure(tight_layout=True)
plt.plot(x, y)
point_ani, = plt.plot(x[0], y[0], "ro")
plt.grid(ls="--")

ani = animation.FuncAnimation(fig, update_points, frames=np.arange(0, 100), interval=100, blit=True)

plt.show()
保存为HTML格式,是不需要安装额外软件的
导入模块加上这一条:
from matplotlib.animation import HTMLWriter
最后加上这一条:
mywriter = HTMLWriter(fps=60)
ani.save('myAnimation.html',writer=mywriter)
保存为gif格式,需要下载一个imagemagick软件,找了我好久才找到软件来源imagemagick:
http://www.imagemagick.org/script/download.php#windows
下载的是dll,下载到任何文件夹下应该都可以。我安装在了python安装程序文件夹下。
代码部分相当简单,只需要在最后加一条:
ani.save('decay.gif',writer='imagemagick',fps=30)
用imagemagick保存
如果下了imagemagick,里面自带了ffmpeg的dll,那么也只需要在最后加一条:
ani.save('decay.gif',writer='ffmpeg',fps=30)
mp4:
用python库保存
如果不像下imagemagick,可以这么做:
from matplotlib.animation import FFMpegWriter
并在最后加上:
mywriter = FFMpegWriter(fps=60)
ani.save('myAnimation.MP4',writer=mywriter)


