ISODATA算法 python实现
文章目录
- 前言
- 一、ISODATA的流程
-
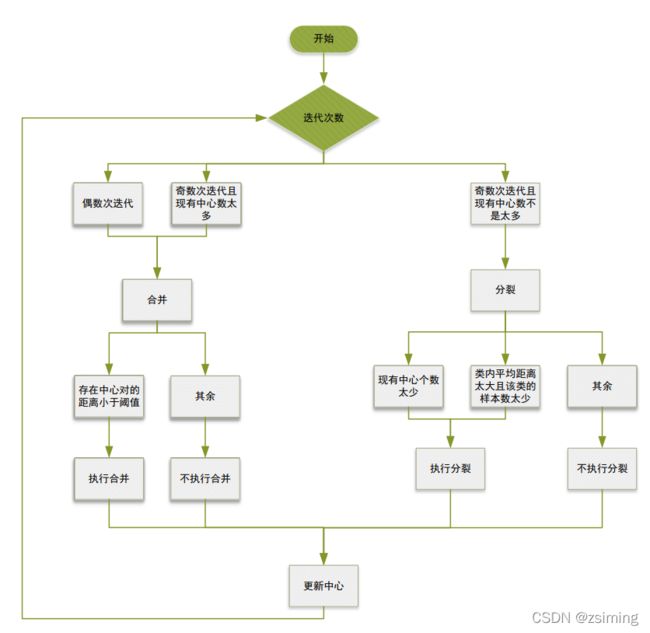
- 1.流程图(这里按迭代的奇偶来判断分裂或者合并)
- 二、使用步骤
-
- 1.代码实现
- 2.迭代过程
- 3. 总结
前言
ISODATA经常被用来与Kmeans算法进行对比,其本质也是按照欧式距离来对样本进行分类,不同的是ISODATA可以根据一个大概的指定类别数去确定最终的聚类数(两者可能不同),而Kmeans指定聚类数是多少后,最终的聚类就一定是多少。
一、ISODATA的流程
本质上只有分裂和合并两个步骤加更新中心三个步骤。了解这个算法,核心需要解决下面的三个问题:
Question 1. 什么时候分裂?
现有的聚类数太少就进行分裂。你一开始指定100个聚类,现在只有2个,那就进行分裂。(大的分裂方向,还有细节见下面流程图)
Question 2. 什么时候合并?
现有的聚类数太多就进行分裂。你一开始指定100个聚类,现在上一次刚好裂成200个,那就进行合并。(大的合并方向,还有细节见下面流程图)
Question 3. 现在有的中心数不上不下怎么办?
如果是奇数次迭代,那就尝试去分裂吧(虽然最后不一定分裂了)
如果是偶数次迭代,那就尝试去合并吧(虽然最后不一定合并了)
1.流程图(这里按迭代的奇偶来判断分裂或者合并)
注意:
在流程图中,“合并”步骤并不一定执行了合并,只有满足在所有的中心中,存在一些中心的距离太近(这个距离低于了设定的阈值)才会真正的执行合并的操作,其余不执行合并的操作。而在分裂中,只有现有的中心数太少或者满足”类内的距离太大而且样本数太少“进行分裂的操作。其中类内的距离太大则表示了这个聚类太过于松散,再加上类的数量太少的话,才进行分裂。
分裂的细节:如何分裂?
计算需要分裂的这个簇在各个维度上的方差,如果最大的方差超过了特定的阈值,就在这个最大方差的维度上分裂成两个,其他维度的值保持不变。
比如现在有一个中心 (1, 3) , 对于属于这个中心的所有样本,我们计算其在第一个维度 (数值1的维度) 的方差,再计算其在第二个维度 (数值3的维度) 的方差。假设维度1计算的方差结果为 0.3,维度2计算的方差为1.5,预先设定的阈值为0.5;所以我们要在第二个维度上把中心分成2个:(1, 3 + 1.5 * k ), (1, 3 - 1.5 *k) ,其中k又是控制分裂远近的一个超参数,在代码中取0.5。由此,我们得到了新分裂的两个中心,并把原来的中心去掉。
合并的细节: 如何合并?
合并使用加权平均的方法,两个权重是两个中心控制的两簇样本的数量百分比,加权求和即可。
二、使用步骤
1.代码实现
Tips: 注意需要用到sklearn的库来产生数据集:
# -*- encoding:utf-8 -*-
"""
@author:zsiming
@fileName:ISODATA.py
@Time:2022/1/9  12:33
"""
import numpy as np
import seaborn as sns
import matplotlib.pyplot as plt
from sklearn.datasets import make_blobs
from sklearn.metrics import euclidean_distances


class ISODATA():
    def __init__(self, designCenterNum, LeastSampleNum, StdThred, LeastCenterDist, iterationNum):
        #  指定预期的聚类数、每类的最小样本数、标准差阈值、最小中心距离、迭代次数
        self.K = designCenterNum
        self.thetaN = LeastSampleNum
        self.thetaS = StdThred
        self.thetaC = LeastCenterDist
        self.iteration = iterationNum

        # 初始化
        self.n_samples = 1500
        # 选一
        self.random_state1 = 200
        self.random_state2 = 160
        self.random_state3 = 170
        self.data, self.label = make_blobs(n_samples=self.n_samples, random_state=self.random_state3)

        self.center = self.data[0, :].reshape((1, -1))
        self.centerNum = 1
        self.centerMeanDist = 0

        # seaborn风格
        sns.set()

    def updateLabel(self):
        """
            更新中心
        """
        for i in range(self.centerNum):
            # 计算样本到中心的距离
            distance = euclidean_distances(self.data, self.center.reshape((self.centerNum, -1)))
            # 为样本重新分配标签
            self.label = np.argmin(distance, 1)
            # 找出同一类样本
            index = np.argwhere(self.label == i).squeeze()
            sameClassSample = self.data[index, :]
            # 更新中心
            self.center[i, :] = np.mean(sameClassSample, 0)

        # 计算所有类到各自中心的平均距离之和
        for i in range(self.centerNum):
            # 找出同一类样本
            index = np.argwhere(self.label == i).squeeze()
            sameClassSample = self.data[index, :]
            # 计算样本到中心的距离
            distance = np.mean(euclidean_distances(sameClassSample, self.center[i, :].reshape((1, -1))))
            # 更新中心
            self.centerMeanDist += distance
        self.centerMeanDist /= self.centerNum

    def divide(self):
        # 临时保存更新后的中心集合,否则在删除和添加的过程中顺序会乱
        newCenterSet = self.center
        # 计算每个类的样本在每个维度的标准差
        for i in range(self.centerNum):
            # 找出同一类样本
            index = np.argwhere(self.label == i).squeeze()
            sameClassSample = self.data[index, :]
            # 计算样本到中心每个维度的标准差
            stdEachDim = np.mean((sameClassSample - self.center[i, :])**2, axis=0)
            # 找出其中维度的最大标准差
            maxIndex = np.argmax(stdEachDim)
            maxStd = stdEachDim[maxIndex]
            # 计算样本到本类中心的距离
            distance = np.mean(euclidean_distances(sameClassSample, self.center[i, :].reshape((1, -1))))
            # 如果最大标准差超过了阈值
            if maxStd > self.thetaS:
                # 还需要该类的样本数大于于阈值很多 且 太分散才进行分裂
                if self.centerNum <= self.K//2 or \
                        sameClassSample.shape[0] > 2 * (self.thetaN+1) and distance >= self.centerMeanDist:
                    newCenterFirst = self.center[i, :].copy()
                    newCenterSecond = self.center[i, :].copy()

                    newCenterFirst[maxIndex] += 0.5 * maxStd
                    newCenterSecond[maxIndex] -= 0.5 * maxStd

                    # 删除原始中心
                    newCenterSet = np.delete(newCenterSet, i, axis=0)
                    # 添加新中心
                    newCenterSet = np.vstack((newCenterSet, newCenterFirst))
                    newCenterSet = np.vstack((newCenterSet, newCenterSecond))

            else:
                continue
        # 更新中心集合
        self.center = newCenterSet
        self.centerNum = self.center.shape[0]

    def combine(self):
        # 临时保存更新后的中心集合,否则在删除和添加的过程中顺序会乱
        delIndexList = []

        # 计算中心之间的距离
        centerDist = euclidean_distances(self.center, self.center)
        centerDist += (np.eye(self.centerNum)) * 10**10
        # 把中心距离小于阈值的中心对找出来
        while True:
            # 如果最小的中心距离都大于阈值的话,则不再进行合并
            minDist = np.min(centerDist)
            if minDist >= self.thetaC:
                break
            # 否则合并
            index = np.argmin(centerDist)
            row = index // self.centerNum
            col = index % self.centerNum
            # 找出合并的两个类别
            index = np.argwhere(self.label == row).squeeze()
            classNumFirst = len(index)
            index = np.argwhere(self.label == col).squeeze()
            classNumSecond = len(index)
            newCenter = self.center[row, :] * (classNumFirst / (classNumFirst+ classNumSecond)) + \
                        self.center[col, :] * (classNumSecond / (classNumFirst+ classNumSecond))
            # 记录被合并的中心
            delIndexList.append(row)
            delIndexList.append(col)
            # 增加合并后的中心
            self.center = np.vstack((self.center, newCenter))
            self.centerNum -= 1
            # 标记,以防下次选中
            centerDist[row, :] = float("inf")
            centerDist[col, :] = float("inf")
            centerDist[:, col] = float("inf")
            centerDist[:, row] = float("inf")

        # 更新中心
        self.center = np.delete(self.center, delIndexList, axis=0)
        self.centerNum = self.center.shape[0]

    def drawResult(self):
        ax = plt.gca()
        ax.clear()
        ax.scatter(self.data[:, 0], self.data[:, 1], c=self.label, cmap="cool")
        # ax.set_aspect(1)
        # 坐标信息
        ax.set_xlabel('x axis')
        ax.set_ylabel('y axis')
        plt.show()


    def train(self):
        # 初始化中心和label
        self.updateLabel()
        self.drawResult()

        # 到设定的次数自动退出
        for i in range(self.iteration):
            # 如果是偶数次迭代或者中心的数量太多,那么进行合并
            if self.centerNum < self.K //2:
                self.divide()
            elif (i > 0 and i % 2 == 0) or self.centerNum > 2 * self.K:
                self.combine()
            else:
                self.divide()
            # 更新中心
            self.updateLabel()
            self.drawResult()
            print("中心数量:{}".format(self.centerNum))


if __name__ == "__main__":
    isoData = ISODATA(designCenterNum=5, LeastSampleNum=20, StdThred=0.1, LeastCenterDist=2, iterationNum=20)
    isoData.train()
2.迭代过程
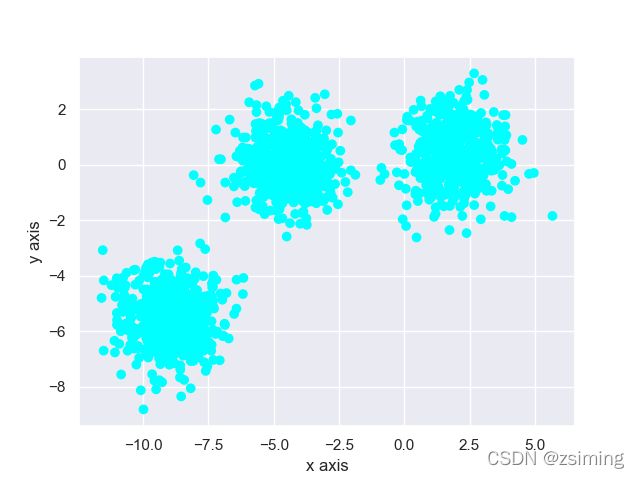
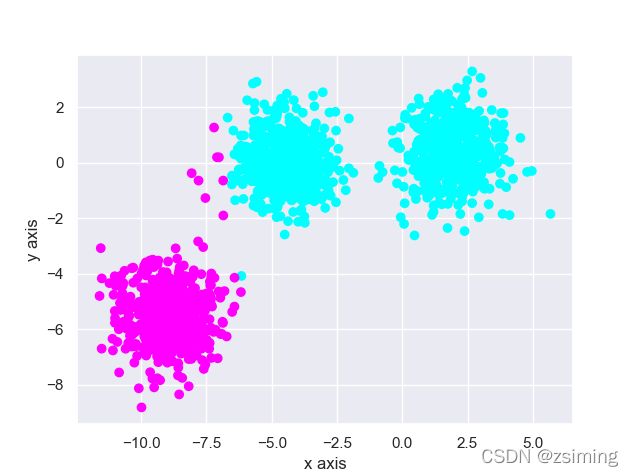
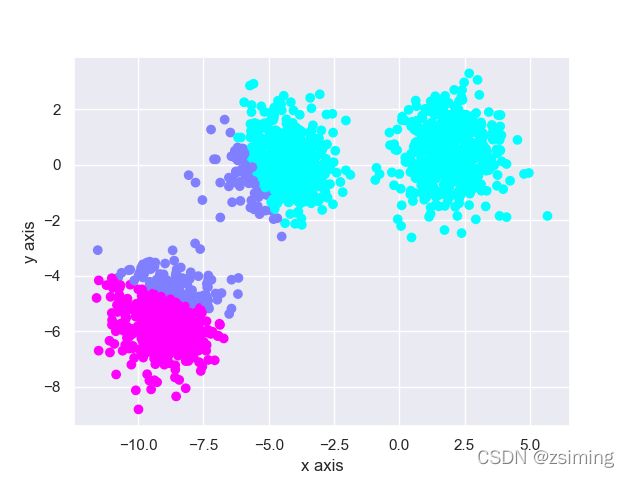
1. 原始数据如下图所示,可以看见我在这儿比较明显的生成三个簇的数据(然后指定类别数为5):
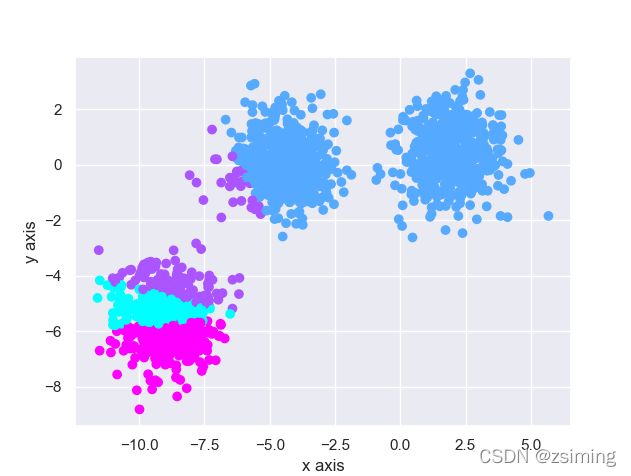
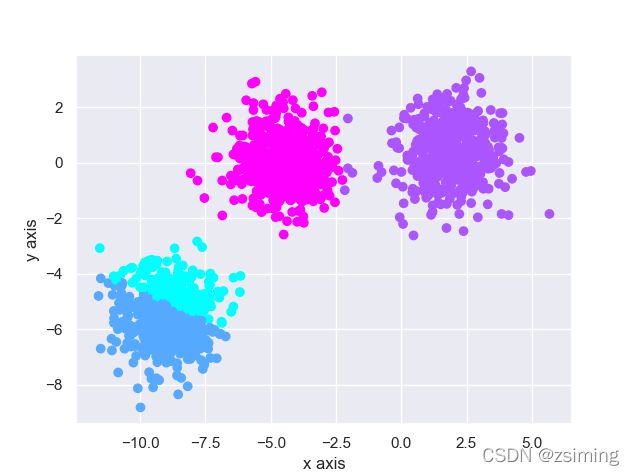
3. 未到达指定类别数(2 < 5)继续分裂为4个中心:
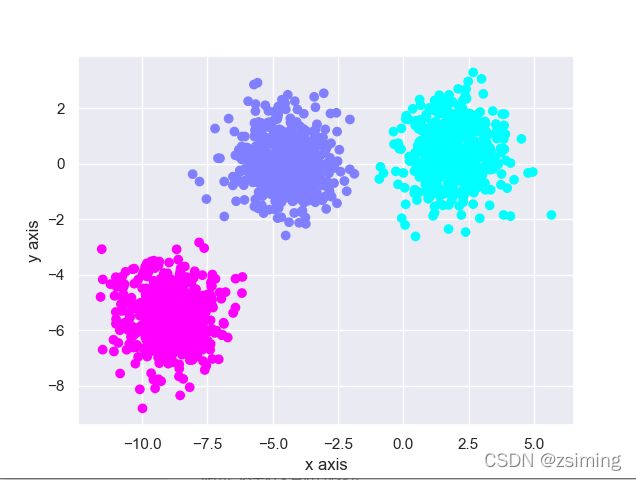
3. 总结
个人觉得:
从参数的角度来看,相比于Kmeans,由一个超参数数变成了六个超参数,不能说是改进。只能说某些先验知识比较完善的情况下,可能适用于数据流形分布比较复杂的场景。
