机器学习训练_金融风控_Task3_特征工程
特征工程
特征工程为建模提前加工原料,不同的模型对数据的类型和形式也有所不同,对数据的处理也不尽相同。下面主要以代码展示特征工程环节,为下一节的建模调参做准备。
导入第三方模块
import pandas as pd
import numpy as np
import missingno as msno
import matplotlib.pyplot as plt
import seaborn as sns
from tqdm import tqdm
from sklearn.preprocessing import LabelEncoder
from sklearn.feature_selection import SelectKBest
from sklearn.feature_selection import chi2
from sklearn.preprocessing import MinMaxScaler
import warnings
from sklearn.model_selection import StratifiedKFold, KFold
from sklearn.metrics import accuracy_score, f1_score, roc_auc_score, log_loss
import datetime
import warnings
warnings.filterwarnings('ignore')
pd.options.display.max_columns = None
pd.set_option('display.float_format', lambda x: '%.2f' % x)
读取数据
train = pd.read_csv(r'D:\Users\Felixteng\Documents\Pycharm Files\loanDefaultForecast\data\train.csv')
testA = pd.read_csv(r'D:\Users\Felixteng\Documents\Pycharm Files\loanDefaultForecast\data\testA.csv')
压缩数据
def reduce_mem_usage(df):
    '''
    遍历DataFrame的所有列并修改它们的数据类型以减少内存使用
    :param df: 需要处理的数据集
    :return:
    '''
    start_mem = df.memory_usage().sum() / 1024 ** 2  # 记录原数据的内存大小
    print('Memory usage of dataframe is {:.2f} MB'.format(start_mem))
    for col in df.columns:
        col_type = df[col].dtypes
        if col_type != object:  # 这里只过滤了object格式,如果代码中还包含其他类型,要一并过滤
            c_min = df[col].min()
            c_max = df[col].max()
            if str(col_type)[:3] == 'int':  # 如果是int类型的话,不管是int64还是int32,都加入判断
                # 依次尝试转化成in8,in16,in32,in64类型,如果数据大小没溢出,那么转化
                if c_min > np.iinfo(np.int8).min and c_max < np.iinfo(np.int8).max:
                    df[col] = df[col].astype(np.int8)
                elif c_min > np.iinfo(np.int16).min and c_max < np.iinfo(np.int16).max:
                    df[col] = df[col].astype(np.int16)
                elif c_min > np.iinfo(np.int32).min and c_max < np.iinfo(np.int32).max:
                    df[col] = df[col].astype(np.int32)
                elif c_min > np.iinfo(np.int64).min and c_max < np.iinfo(np.int64).max:
                    df[col] = df[col].astype(np.int64)
            else:  # 不是整形的话,那就是浮点型
                if c_min > np.finfo(np.float16).min and c_max < np.finfo(np.float16).max:
                    df[col] = df[col].astype(np.float16)
                elif c_min > np.finfo(np.float32).min and c_max < np.finfo(np.float32).max:
                    df[col] = df[col].astype(np.float32)
                else:
                    df[col] = df[col].astype(np.float64)
        else:  # 如果不是数值型的话,转化成category类型
            df[col] = df[col].astype('category')

    end_mem = df.memory_usage().sum() / 1024 ** 2    # 看一下转化后的数据的内存大小
    print('Memory usage after optimization is {:.2f} MB'.format(end_mem))
    print('Decreased by {:.1f}%'.format(100 * (start_mem - end_mem) / start_mem))  # 看一下压缩比例
    return df
train = reduce_mem_usage(train)
testA = reduce_mem_usage(testA)
特征预处理
首先我们查找出数据中的标签、对象特征和数值特征
numerical_fea = list(train.select_dtypes(exclude=['category']).columns)
category_fea = list(filter(lambda x: x not in numerical_fea, list(train.columns)))
label = 'isDefault'
numerical_fea.remove(label)
缺失值处理
# ## 查看缺失值情况
train.info()
train.isnull().sum()
将训练集的缺失数据可视化
missing = train.isnull().sum()
missing = missing[missing > 0]
missing.sort_values(ascending=False, inplace=True)
missing.plot.bar()

msno.matrix(train.sample(250))
msno.bar(train.sample(1000))
缺失数据并不多
按照平均数填充数值型特征
train[numerical_fea] = train[numerical_fea].fillna(train[numerical_fea].median())

testA[numerical_fea] = testA[numerical_fea].fillna(testA[numerical_fea].median())
'''特征处理的时候,测试集要做同样的处理'''
按照众数填充类别型特征
train[category_fea] = train[category_fea].fillna(train[category_fea].mode())
testA[category_fea] = testA[category_fea].fillna(testA[category_fea].mode())
train.isnull().sum()
train.head()
'''发现employmentLength没有按照众数填充,因为不是数值'''
处理category特征
category_fea
'''['grade', 'subGrade', 'employmentLength', 'issueDate', 'earliesCreditLine']'''
时间格式处理
issueDate - 贷款发放月份
for data in [train, testA]:
    data['issueDate'] = pd.to_datetime(data['issueDate'], format='%Y-%m-%d')
    # 从数据可以看出,issueDate从2017年6月1日开始
    '''train.groupby('issueDate')['id'].count()'''
    startdate = datetime.datetime.strptime('2007-06-01', '%Y-%m-%d')
    data['issueDateDT'] = data['issueDate'].apply(lambda x: x - startdate).dt.days
employmentLength - 就业年限(年) 不满一年按0年算
train.groupby('employmentLength')['id'].count()


def employment_re(x):
    if pd.isnull(x):
        return x
    elif x == '< 1 year':
        return 0
    elif x == '1 year':
        return 1
    elif x == '2 years':
        return 2
    elif x == '3 years':
        return 3
    elif x == '4 years':
        return 4
    elif x == '5 years':
        return 5
    elif x == '6 years':
        return 6
    elif x == '7 years':
        return 7
    elif x == '8 years':
        return 8
    elif x == '9 years':
        return 9
    else:
        return 10


train['employmentLength'] = train['employmentLength'].apply(lambda x: employment_re(x))
train['employmentLength'] = train['employmentLength'].fillna(train['employmentLength'].mode())
testA['employmentLength'] = testA['employmentLength'].fillna(testA['employmentLength'].mode())
earliesCreditLine - 借款人最早报告的信用额度开立的月份
for data in [train, testA]:
    data['earliesCreditLine'] = data['earliesCreditLine'].apply(lambda s: int(s[-4:]))
类别特征处理
cate_features = ['grade', 'subGrade', 'employmentTitle', 'homeOwnership', 'verificationStatus', 'purpose', 'postCode', 'regionCode', \
                 'applicationType', 'initialListStatus', 'title', 'policyCode']
for f in cate_features:
    print(f, '类型数:', train[f].nunique())

'''
grade 类型数: 7
subGrade 类型数: 35
employmentTitle 类型数: 248683
homeOwnership 类型数: 6
verificationStatus 类型数: 3
purpose 类型数: 14
postCode 类型数: 932
regionCode 类型数: 51
applicationType 类型数: 2
initialListStatus 类型数: 2
title 类型数: 6509
policyCode 类型数: 1
'''
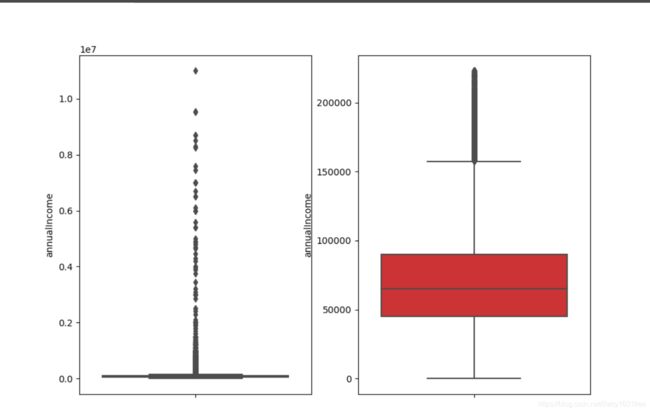
异常值处理 - 这里封装了箱线图的代码用于处理异常值,尺度scale为3,可以视情况缩小
def outliers_proc(data, col_name, scale=3):
    '''
    用于清洗异常值,默认用box_plot(scale=3)进行清洗 - 箱线图处理异常值
    :param data: 接收pandas数据格式
    :param col_name: pandas列名
    :param scale: 尺度
    :return:
    '''

    def box_plot_outliers(data_ser, box_scale):
        '''
        利用箱线图去除异常值
        :param data_ser: 接收pandas.Series数据格式
        :param box_scale: 箱线图尺度
        :return:
        '''
        # quantile(0.75) - 求数据的上四分位数 - Q3
        # quantile(0.25) - 求数据的下四分位数 - Q1
        # data_ser.quantile(0.75) - data_ser.quantile(0.25) = Q3 - Q1 = ΔQ --> 四分位距
        '''
        boxplot默认的上边缘到上四分位数的间距是1.5ΔQ,即 scale=1.5

        这里设定的为3ΔQ:
        超过了上边缘Q3+3ΔQ和下边缘Q1-3ΔQ的部分视为异常值
        '''
        iqr = box_scale * (data_ser.quantile(0.75) - data_ser.quantile(0.25))  # iqr - 上边缘到上四分位数的间距,即3ΔQ
        val_low = data_ser.quantile(0.25) - iqr  # 下边缘 Q1-3ΔQ
        val_up = data_ser.quantile(0.75) + iqr  # 上边缘 Q3+3ΔQ
        rule_low = (data_ser < val_low)  # 低于下边缘 Q1-3ΔQ的为异常值
        rule_up = (data_ser > val_up)  # 高于上边缘 Q3+3ΔQ的为异常值
        return (rule_low, rule_up), (val_low, val_up)  # 得到异常值 / 上边缘与下边缘之间的值

    data_n = data.copy()  # 拷贝一份数据的副本
    data_series = data_n[col_name]  # 转化成pandas.Series数据格式
    rule, value = box_plot_outliers(data_series, box_scale=scale)
    # data_series.shape[0] - 看data_series这个一维数组有几行,即原数据集的总列数
    '''
    np.arange() - 函数返回一个有终点和起点的固定步长的排列
                    一个参数时:参数值为终点,起点取默认值0,步长取默认值1
                    两个参数时:第一个参数为起点,第二个参数为终点,步长取默认值1
                    三个参数时:第一个参数为起点,第二个参数为终点,第三个参数为步长,其中步长支持小数
    '''
    # np.arange(data_series.shape[0]) - 取N个数,N为数据集字段数,步长为1  --> 生成的是列表
    index = np.arange(data_series.shape[0])[rule[0] | rule[1]]  # 挑出位于异常值区间的序号,放进标记为index的列表中
    print('Delete number is: {}'.format(len(index)))  # 输出要删除多少个异常值

    data_n = data_n.drop(index)  # 按索引查找并删除

    '''
    reset_index() - 重塑索引 (因为有时候对dataframe做处理后索引可能是乱的,就像上面删除了异常值一样)

    参数详解:
    drop - True:把原来的索引index列去掉,重置index      False:保留原来的索引,添加重置的index
    inplace - True:原数组不变,对数据进行修改之后结果给新的数组     False:直接在原数组上对数据进行修改
    '''
    data_n.reset_index(drop=True, inplace=True)
    print('Now column number is: {}'.format(data_n.shape[0]))  # 打印出现在的行数,即正常值的个数

    index_low = np.arange(data_series.shape[0])[rule[0]]  # 挑出位于下异常值区间的序号,放进标记为index_low的列表中
    outliers_low = data_series.iloc[index_low]  # 把位于下异常值区间的数据放进outliers中
    print('Description of data less than the lower bound is: ')
    print(pd.Series(outliers_low).describe())  # 对于位于下异常值区间的数据,做一个统计描述

    index_up = np.arange(data_series.shape[0])[rule[1]]  # 挑出位于上异常值区间的序号,放进标记为index_up的列表中
    outliers_up = data_series.iloc[index_up]  # 把位于上异常值区间的数据放进outliers_up中
    print('Description of data larger than the lower bound is: ')
    print(pd.Series(outliers_up).describe())  # 对于位于上异常值区间的数据,再做一个统计描述

    fig, ax = plt.subplots(1, 2, figsize=(10, 7))

    '''
    sns.boxplot - 箱线图

    参数详解:
    x, y, hue - 数据或向量数据的变量名称
    data - 用于绘图的数据集
    palette - 调色板名称
    ax - 绘图时使用的matplotlib轴对象
    '''
    sns.boxplot(y=data[col_name], data=data, palette='Set1', ax=ax[0])
    sns.boxplot(y=data_n[col_name], data=data_n, palette='Set1', ax=ax[1])
    return data_n
以年收入annualIncome为例
outliers_proc(train, 'annualIncome')
总结
特征的相关行分析和特征筛选我想放在task4做。我对特征工程的理解就是处理数据,把脏数据清洗之后按照不同的模型做相应的变换,如one-hot编码,归一化处理等等。
具体看task4选择哪些模型在做响应的特征的处理。这边文章主要讲的是方法,具体涉及到每个特征的处理,还需要自己慢慢去尝试。

