Python深度学习第四章——机器学习基础
4.1-4.3 整理
1、机器学习的四个分支:
监督学习:目前最多,通常需要人工标注,主要包括回归和分类、序列生成、语法树预测、目标检测、图像分割
无监督学习:没有目标情况下寻找输入数据的有趣变换,目的在于数据可视化、数据压缩、数据去噪或更好地理解数据中的相关性。降维和聚类是常见的无监督学习方法。
自监督学习:没有人工标注标签的监督学习,标签仍然存在,但是他们由输入数据生成,通常使用启发式算法生成。自编码器是有名的监督学习例子。 强化学习:对话机器人,强化学习。
2、机器学习的目的是得到可以泛化的模型,即在前所未有的数据上表现出很好的模型,而过拟合则是核心难点。
3、评估模型的重点是将数据划分为三个集合:训练集、验证集和测试集。开发模型时候需要调节模型配置,比如选择层数或者每层的大小(模型超参数,区别与模型参数(权重))这个调节过程需要使用模型在验证数据上的性能作为反馈信号,调节本质就是一种学习:在某个参数空间中寻找良好的模型配置。如果基于验证集上的性能来调节模型配置,会很快导致模型在验证集上过拟合,即使没有在验证集上直接训练也会出现这种现象。主要原因是信息泄露(理解:你重复很多次一样的东西给电脑学习,答案他都记住了,就不好好给你学了)
4、三种经典的评估方法:简单留出验证、K折验证、带有打乱数据的重复K折验证
1)留出验证,通常先进行数据打乱。这是最简单的评估方法。缺点:如果可以使用的数据非常少,那么可能验证集合测试集包含的样本就太少,从而无法在统计学上代表数据。
2)K折验证将数据划分为大小相同的K个分区。对于每个分区i,在剩余的K-1个分区上训练模型,然后在分区i上进行评估。最终分数等于K个分数的平均值。对于不同的训练集-测试集划分,如果模型性能的变化很大,这方法很有用。
3)带有打乱数据的K折验证可以在数据集很小的情况下提高较高的精确度。
5、评估模型的注意事项:
1)数据代表性(打乱数据)
2)时间箭头(天气预测、股票价格等与前一天相关的问题不应该打乱数据,要保持测试集种所有数据的时间都晚于训练集数据)
3)数据冗余:确保训练集和验证集之间没有交集。
6、数据预处理:
1)向量化:神经网络的所有输入目标都必须是浮点数张量(特定情况下是整数)。所有数据在训练前都要转化为张量。
2)值标准化:数据范围较大时,需要将数据缩小在较小的范围内,如手写数字分类中所有的图像数据被编码为0~255范围内的整数,输入网络前需要将它转化为float32格式并除以255,这样就得到了0~1范围内的浮点数。一般来说将取值较大的数据或者异质数据(几个特征的范围不一致)输入到网络前需要将数据转化为0~1的范围,并且保证特征的同质性。否则将进行较大的梯度更新,导致网络无法收敛。
3)数据中的缺失值设置为0是比较安全的,电脑会学习这个数据没有意义并且忽略它。 7、特征工程:将数据输入模型之前,利用数据和机器学习算法对数据进行硬编码的转换(不是模型学习的),来改善模型的效果。
4.4 过拟合与欠拟合
几种方法解决过拟合
- 增加训练资料
- 减小网络大小
- 添加权重正则化
- 添加dropout正则化
使用第三章中的电影评论分类问题进行过拟合的探究,数据集imdb
# 数据集使用第三章中电影评论二分类问题
from keras.datasets import imdb
(train_data, train_labels), (test_data, test_labels) = imdb.load_data(num_words=10000)

# 将整数序列码编码为二进制矩阵
import numpy as np

def vectorize_sequences(sequences, dimension=10000):
    results = np.zeros((len(sequences), dimension))
    for i, sequence in enumerate(sequences):
        results[i, sequence]=1.
    return results

x_train = vectorize_sequences(train_data)
x_test = vectorize_sequences(test_data)

y_train = np.asarray(train_labels).astype('float32')
y_test = np.asarray(test_labels).astype('float32')

#网络构建 模型定义
from keras import models
from keras import layers
model = models.Sequential()
model.add(layers.Dense(16, activation='relu', input_shape=(10000,)))
model.add(layers.Dense(16, activation='relu'))
model.add(layers.Dense(1, activation='sigmoid'))

#模型编译
model.compile(optimizer='rmsprop',
             loss='binary_crossentropy',
             metrics=['accuracy'])

#留出验证集
x_val = x_train[:10000]
partial_x_train = x_train[10000:]
y_val = y_train[:10000]
partial_y_train = y_train[10000:]

#模型训练
history = model.fit(partial_x_train,
                   partial_y_train,
                   epochs=20, batch_size=512, validation_data=(x_val, y_val))
history_dict = history.history
定义更小的模型,进行训练结果的对比
smaller_model = models.Sequential()
smaller_model.add(layers.Dense(4, activation='relu', input_shape=(10000,)))
smaller_model.add(layers.Dense(4, activation='relu'))
smaller_model.add(layers.Dense(1, activation='sigmoid'))

smaller_model.compile(optimizer='rmsprop',
             loss='binary_crossentropy',
             metrics=['accuracy'])

smaller_history = smaller_model.fit(partial_x_train,
                   partial_y_train,
                   epochs=20, batch_size=512, validation_data=(x_val, y_val))
epochs = range(1,21)
original_val_loss = history.history['val_loss']
smaller_val_loss = smaller_history.history['val_loss']
#对比原始模型的验证曲线和更小模型的验证曲线
import matplotlib.pyplot as plt
# b+ is for 'blue cross'
plt.plot(epochs,original_val_loss,'b+',label='Original model')
# 'bo' is for 'blue dot'
plt.plot(epochs,smaller_val_loss,'bo',label='Smaller model')
plt.xlabel('Epochs')
plt.ylabel('Validation Loss')
plt.legend()
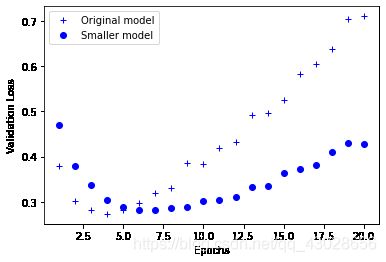
plt.show()从上面结果可以看出,原始的model在epochs为4左右就开始过拟合了,而smaller one过拟合出现在第七轮左右,显著的改善了过拟合性质。下面再做一个用更大容量的模型做一个测试。
bigger_model = models.Sequential()
bigger_model.add(layers.Dense(512, activation='relu', input_shape=(10000,)))
bigger_model.add(layers.Dense(512, activation='relu'))
bigger_model.add(layers.Dense(1, activation='sigmoid'))

bigger_model.compile(optimizer='rmsprop',
             loss='binary_crossentropy',
             metrics=['accuracy'])

bigger_history = bigger_model.fit(partial_x_train,
                   partial_y_train,
                   epochs=20, batch_size=512, validation_data=(x_val, y_val))

bigger_val_loss = bigger_history.history['val_loss']
import matplotlib.pyplot as plt
# b+ is for 'blue cross'
plt.plot(epochs,original_val_loss,'b+',label='Original model')
# 'bo' is for 'blue dot'
plt.plot(epochs,smaller_val_loss,'bo',label='Smaller model')
plt.plot(epochs,bigger_val_loss,'ro',label='Bigger model')
plt.xlabel('Epochs')
plt.ylabel('Validation Loss')
plt.legend()

plt.show()
更大的容量导致训练损失很快接近于0,通络越大,它拟合训练数据的速度就越快,但是更加容易过拟合(导致训练损失和验证损失有很大的差异)
添加权重正则化
- 给出一些训练数据和一种网络构架,很多组权重值(即很多模型)都可以解释这些数据。简单的模型比复杂模型更不容易过拟合
- 简单模型指参数值分布熵更小的模型(参数更少)。因此一种常见的降低过拟合的方法是强制让模型权重只能取较小的值,使得权重的值更加规则,这种方法叫做 权重正则化
- 实现方法是向网络损失函数中添加较大的权重值相关的成本,这个成本有两种形式
1)L1正则化 添加的成本与权重系数的绝对值成正比
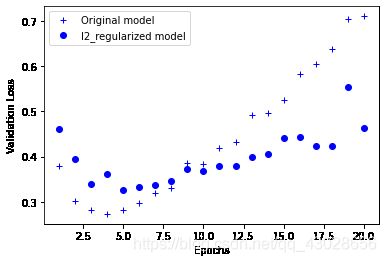
2)L2正则化 添加的成本与权重系数的平方成正比。神经网络L2正则化也叫做权重衰减。 - keras中添加正则化的方式是向层传递权重正则化项实例(weight regularizer instance)
from keras import regularizers

l2_regularized_model = models.Sequential()
l2_regularized_model.add(layers.Dense(16, kernel_regularizer=regularizers.l2(0.001),
                      activation='relu', input_shape=(10000,)))
l2_regularized_model.add(layers.Dense(16, kernel_regularizer=regularizers.l2(0.001),
                      activation='relu'))
l2_regularized_model.add(layers.Dense(1, activation='sigmoid'))

l2_regularized_model.compile(optimizer='rmsprop',
             loss='binary_crossentropy',
             metrics=['accuracy'])

l2_regularized_history = l2_regularized_model.fit(partial_x_train,
                   partial_y_train,
                   epochs=20, batch_size=512, validation_data=(x_val, y_val))
l2_regularized_val_loss = l2_regularized_history.history['val_loss']

#绘制对比曲线
import matplotlib.pyplot as plt
# b+ is for 'blue cross'
plt.plot(epochs,original_val_loss,'b+',label='Original model')
# 'bo' is for 'blue dot'
plt.plot(epochs,l2_regularized_val_loss,'bo',label='l2_regularized model')
plt.xlabel('Epochs')
plt.ylabel('Validation Loss')
plt.legend()
plt.show()
# 还可以使用Keras中其他的正则化
from keras import regularizers
regularizers.l1(0.001) #l1正则化
regularizers.l1_l2(l1=0.001, l2=0.001) # 同时做l1,l2正则化
添加dropout正则化
- 功能是防止神经网络学习一些偶然发生的情况
dropout_model = models.Sequential()
dropout_model.add(layers.Dense(16, activation='relu', input_shape=(10000,)))
dropout_model.add(layers.Dropout(0.5))
dropout_model.add(layers.Dense(16, activation='relu'))
dropout_model.add(layers.Dropout(0.5))
dropout_model.add(layers.Dense(1, activation='sigmoid'))

dropout_model.compile(optimizer='rmsprop',
             loss='binary_crossentropy',
             metrics=['accuracy'])

dropout_history = dropout_model.fit(partial_x_train,
                   partial_y_train,
                   epochs=20, batch_size=512, validation_data=(x_val, y_val))
dropout_val_loss = dropout_history.history['val_loss']

import matplotlib.pyplot as plt
# b+ is for 'blue cross'
plt.plot(epochs,original_val_loss,'b+',label='Original model')
# 'bo' is for 'blue dot'
plt.plot(epochs,dropout_val_loss,'bo',label='dropout model')
plt.xlabel('Epochs')
plt.ylabel('Validation Loss')
plt.legend()
plt.show()
Conclusion~
机器学习工作的通用流程
- 定义问题,收集数据:分析问题,明确输入数据和将要预测的内容。明确将要探索的问题是什么类型(二分类,多分类,标量回归,向量回归,多标签,强化学习等)。注意,对于不平稳问题,比如股票价格问题比较难训练。根据历史价格推出今后股价几乎不可能。
- 选择衡量成功的指标:就是给出成功的定义,就是准确率或者召回率? 成功的指标是选择loss function的关键,即模型要对什么进行优化。
- 对于平衡分类问题:精度和接收者操作特征曲线下面积(ROC AUC)是常用的指标
- 对于类别不平衡的问题,可以使用准确率和召回率
- 对于排序或多标签分类问题 :可以用平均准确率均值
- 确定评估方法(三种常见):
- 留出验证集(数据量大的时候好用)
- K折交叉验证(数据量小)
- 重复的K折交叉(数据量小,且要求高准确率)
- 准备数据:
- 将数据格式化为张量
- 张量取值应该通常缩放为较小的值[-1,1]、[0,1]
- 不同的特征具有不同的取值范围(异质数据)时,应该对数据进行标准化
- 对小数据问题,可能要进行特征工程(编码)
- 开发比基准更好的模型:目标市获得统计功效
- 最后一层的激活函数:多分类单标签问题用softmax,二分类、多标签多分类、回归到0~1范围内的问题都用sigmoid
- 损失函数
- 优化配置
- 扩大模型规模:开发一个过拟合的模型
- 添加更多的层
- 让每一层容量变得更大
- 训练更多的轮次
- 模型正则化与调节超参数
- 添加dropout
- 尝试不同的架构:增加或者减少层数
- 添加L1或者L2正则化
- 尝试不同的超参数(每层的单元个数,或者优化器的学习率),已找到最佳配置


