【DW组队学习—动手学数据分析】第二章:第四节数据可视化
**复习:**回顾学习完第一章,我们对泰坦尼克号数据有了基本的了解,也学到了一些基本的统计方法,第二章中我们学习了数据的清理和重构,使得数据更加的易于理解;今天我们要学习的是第二章第三节:数据可视化,主要给大家介绍一下Python数据可视化库Matplotlib,在本章学习中,你也许会觉得数据很有趣。在打比赛的过程中,数据可视化可以让我们更好的看到每一个关键步骤的结果如何,可以用来优化方案,是一个很有用的技巧。
2 第二章:数据可视化
开始之前,导入numpy、pandas以及matplotlib包和数据
# 加载所需的库
# 如果出现 ModuleNotFoundError: No module named 'xxxx'
# 你只需要在终端/cmd下 pip install xxxx 即可
import numpy as np
import pandas as pd
import matplotlib.pyplot as plt
#加载result.csv这个数据
result = pd.read_csv("result.csv")
result.head()
| Unnamed: 0 | PassengerId | Survived | Pclass | Name | Sex | Age | SibSp | Parch | Ticket | Fare | Cabin | Embarked | |
|---|---|---|---|---|---|---|---|---|---|---|---|---|---|
| 0 | 0 | 1 | 0 | 3 | Braund, Mr. Owen Harris | male | 22.0 | 1 | 0 | A/5 21171 | 7.2500 | NaN | S |
| 1 | 1 | 2 | 1 | 1 | Cumings, Mrs. John Bradley (Florence Briggs Th... | female | 38.0 | 1 | 0 | PC 17599 | 71.2833 | C85 | C |
| 2 | 2 | 3 | 1 | 3 | Heikkinen, Miss. Laina | female | 26.0 | 0 | 0 | STON/O2. 3101282 | 7.9250 | NaN | S |
| 3 | 3 | 4 | 1 | 1 | Futrelle, Mrs. Jacques Heath (Lily May Peel) | female | 35.0 | 1 | 0 | 113803 | 53.1000 | C123 | S |
| 4 | 4 | 5 | 0 | 3 | Allen, Mr. William Henry | male | 35.0 | 0 | 0 | 373450 | 8.0500 | NaN | S |
2.7 如何让人一眼看懂你的数据?
《Python for Data Analysis》第九章
2.7.1 任务一:跟着书本第九章,了解matplotlib,自己创建一个数据项,对其进行基本可视化
【思考】最基本的可视化图案有哪些?分别适用于那些场景?(比如折线图适合可视化某个属性值随时间变化的走势)
【总结】常见可视化图表 更多图表可参考:https://blog.csdn.net/weixin_41545602/article/details/111828028
- 柱状图
适用场景:它的适用场合是二维数据集(每个数据点包括两个值x和y),但只有一个维度需要比较。
优势:柱状图利用柱子的高度,反映数据的差异。肉眼对高度差异很敏感,辨识效果非常好。
劣势:柱状图的局限在于只适用中小规模的数据集。 - 折线图
适用场景: 折线图适合二维的大数据集,尤其是那些趋势比单个数据点更重要的场合。它还适合多个二维数据集的比较。
优势:容易反应出数据变化的趋势。 - 饼图
适用场景:适用简单的占比图,在不要求数据精细的情况下可以适用。
优势:可以直观观察到各部分占比情况。
劣势:饼图是一种应该避免使用的图表,因为肉眼对面积大小不敏感。
【注】最好的做法是从12点方向开始,顺时针按份额大小排列。 - 漏斗图
适用场景:漏斗图适用于业务流程比较规范、周期长、环节多的流程分析,通过漏斗各环节业务数据的比较,能够直观地发现和说明问题所在。
优势:能够直观地发现和说明问题所在。在网站分析中,通常用于转化率比较,它不仅能展示用户从进入网站到实现购买的最终转化率,还可以展示每个步骤的转化率。
劣势:单一漏斗图无法评价网站某个关键流程中各步骤转化率的好坏。 - 地图
适用场景:适用于有空间位置的数据集。
优劣势:特殊状况下使用。 - 雷达图
适用场景:雷达图适用于多维数据(四维以上),且每个维度必须可以排序。但是,它有一个局限,就是数据点最多6个,否则无法辨别,因此适用场合有限。
劣势:需要注意的时候,用户不熟悉雷达图,解读有困难。使用时尽量加上说明,减轻解读负担。
【注】可视化图表使用的注意事项
- 在折线图中使用虚线。虚线会让人分心,用实线搭配合适的颜色更容易区分。
- 数据被遮盖。确保数据不会因为设计而丢失或被覆盖。例如在面积图中使用透明效果来确保用户可以看到全部数据。
- 耗费用户更多的精力。通过辅助的图形元素来使数据更易于理解,比如在散点图中增加趋势线。
- 柱状过宽或过窄。柱子的间隔最好调整为宽的1/2。
- 数据对比困难。选择合适的图表,让数据对比更明显直接。
- 错误呈现数据。
- 数据没有很好归类,没有重点区分。将同类数据归类,简化色彩,帮助用户更快理解数据。
- 误导用户的图表。要客观反映真实数据,纵坐标不能被截断,否则视觉感受和实际数据相差很大。
【参考】https://nn.sumaart.com/share/119.html
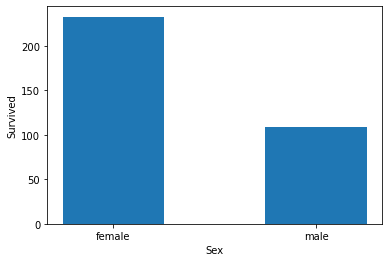
2.7.2 任务二:可视化展示泰坦尼克号数据集中男女中生存人数分布情况(用柱状图试试)。
**matplotlib.pyplot.bar(x,height, width,*,align=‘center’,kwargs)
参数:
- x:包含所有柱子的下标的列表
- height:包含所有柱子的高度值的列表
- width:每个柱子的宽度。可以指定一个固定值,那么所有的柱子都是一样的宽。或者设置一个列表,这样可以分别对每个柱子设定不同的宽度。
- align:柱子对齐方式,有两个可选值:center和edge。center表示每根柱子是根据下标来对齐, edge则表示每根柱子全部以下标为起点,然后显示到下标的右边。如果不指定该参数,默认值是center。
其他可选参数:
- color:每根柱子呈现的颜色。同样可指定一个颜色值,让所有柱子呈现同样颜色;或者指定带有不同颜色的列表,让不同柱子显示不同颜色。
- edgecolor:每根柱子边框的颜色。同样可指定一个颜色值,让所有柱子边框呈现同样颜色;或者指定带有不同颜色的列表,让不同柱子的边框显示不同颜色。
- linewidth:每根柱子的边框宽度。如果没有设置该参数,将使用默认宽度,默认是没有边框。
- tick_label:每根柱子上显示的标签,默认是没有内容。
- xerr:每根柱子顶部在横轴方向的线段。如果指定一个固定值,所有柱子的线段将一直长;如果指定一个带有不同长度值的列表,那么柱子顶部的线段将呈现不同长度。
- yerr:每根柱子顶端在纵轴方向的线段。如果指定一个固定值,所有柱子的线段将一直长;如果指定一个带有不同长度值的列表,那么柱子顶部的线段将呈现不同长度。
- ecolor:设置 xerr 和 yerr 的线段的颜色。同样可以指定一个固定值或者一个列表。
- capsize:这个参数很有趣, 对xerr或者yerr的补充说明。一般为其设置一个整数,例如 10。如果你已经设置了yerr 参数,那么设置 capsize 参数,会在每跟柱子顶部线段上面的首尾部分增加两条垂直原来线段的线段。对 xerr 参数也是同样道理。可能看说明会觉得绕,如果你看下图就一目了然了。
- error_kw:设置 xerr 和 yerr 参数显示线段的参数,它是个字典类型。如果你在该参数中又重新定义了 ecolor 和 capsize,那么显示效果以这个为准。
- orientation:设置柱子是显示方式。设置值为 vertical ,那么显示为柱形图。如果设置为 horizontal 条形图。不过 matplotlib 官网不建议直接使用这个来绘制条形图,使用barh来绘制条形图。
#代码编写
sex_survived = result.groupby(["Sex"])["Survived"].sum()
sex_survived
Sex
female    233
male      109
Name: Survived, dtype: int64
sex_survived_bar = plt.bar(sex_survived.index, height = sex_survived.values, width = 0.5)
plt.xlabel("Sex")
plt.ylabel("Survived")
plt.show()
【思考】计算出泰坦尼克号数据集中男女中死亡人数,并可视化展示?如何和男女生存人数可视化柱状图结合到一起?看到你的数据可视化,说说你的第一感受(比如:你一眼看出男生存活人数更多,那么性别可能会影响存活率)。
sex = result.groupby(["Sex"])["Sex"].count()
sex
Sex
female    314
male      577
Name: Sex, dtype: int64
#思考题回答
sex_dead = result.groupby(["Sex"])["Sex"].count()-result.groupby(["Sex"])["Survived"].sum()
sex_dead
Sex
female     81
male      468
dtype: int64
sex_dead_bar = plt.bar(sex_dead.index, sex_dead.values)
plt.show()
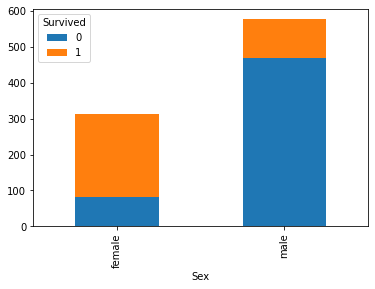
2.7.3 任务三:可视化展示泰坦尼克号数据集中男女中生存人与死亡人数的比例图(用柱状图试试)。
把上述两个柱状图结合起来,可以考虑使用堆积柱状图
法一:使用plt的绘图方法
先bar底部图,再bar顶部图,并用bottom设置底部数据,然后用legend函数检测元素
**matplotlib.pyplot.legend(*args, kwargs)
在坐标轴上放置一个图例。
当不传递任何额外参数时,将自动确定要添加到图例的元素。
需要指定个别标签的时候,可以传递列表参数进行指定。
plt.bar(sex_survived.index, sex_survived.values, label = "survived-1", width = 0.5)
plt.bar(sex_dead.index, sex_dead.values, bottom=sex_survived.values, label = "deaded-0", width = 0.5)
plt.legend()
plt.show()
法二:使用pandas的绘图方法
将Survived列的数据分组后变成表格结构(unstack),并在此基础上进行画图
**DataFrame.plot(*args, kwargs)
参数:
- kind:绘图类型
- ‘line’ : 折线图(默认)
- ‘bar’ : 垂直柱状图
- ‘barh’ : 水平柱状图
- ‘hist’ : 直方图
- ‘box’ : 箱型图
- ‘kde’ : 核密度图
- ‘density’ : 密度图,同‘kde’
- ‘area’ : 面积图
- ‘pie’ : 饼图
- ‘scatter’ : 散点图(仅DataFrame)
- ‘hexbin’ : 六边形分箱图(仅DataFrame)
- stacked:bool,折线图和条形图默认为 False,面积图默认为 True。如果为真,则创建堆积图。
- 其他参数详见https://pandas.pydata.org/pandas-docs/stable/reference/api/pandas.DataFrame.plot.html?highlight=plot#pandas.DataFrame.plot
test = result.groupby(['Sex','Survived'])['Survived'].count().unstack()
test
| Survived | 0 | 1 |
|---|---|---|
| Sex | ||
| female | 81 | 233 |
| male | 468 | 109 |
test.plot(kind='bar',stacked='True')
通过上图可以直观看出,男性的存活率低于女性存活率
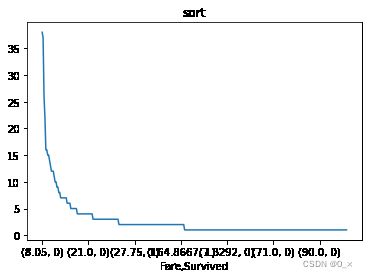
2.7.4 任务四:可视化展示泰坦尼克号数据集中不同票价的人生存和死亡人数分布情况。(用折线图试试)(横轴是不同票价,纵轴是存活人数)
【提示】对于这种统计性质的且用折线表示的数据,你可以考虑将数据排序或者不排序来分别表示。看看你能发现什么?
#代码编写
# 计算不同票价中生存与死亡人数 1表示生存,0表示死亡
fare_person = result.groupby(["Fare", "Survived"])["Fare"].count()
fare_person
Fare      Survived
0.0000    0           14
          1            1
4.0125    0            1
5.0000    0            1
6.2375    0            1
                      ..
247.5208  1            1
262.3750  1            2
263.0000  0            2
          1            2
512.3292  1            3
Name: Fare, Length: 330, dtype: int64
fare_person.sort_values(ascending=False)
Fare     Survived
8.0500   0           38
7.8958   0           37
13.0000  0           26
7.7500   0           22
13.0000  1           16
                     ..
20.2500  1            1
         0            1
79.6500  0            1
18.7875  1            1
15.0500  0            1
Name: Fare, Length: 330, dtype: int64
fare_person.sort_values(ascending=False).plot(title = "sort")
fare_person.plot(title = "unsort")
可以看出,排序后的趋势更为明显,更容易观察趋势以及大概的分布情况。
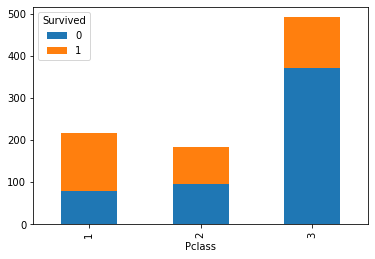
2.7.5 任务五:可视化展示泰坦尼克号数据集中不同仓位等级的人生存和死亡人员的分布情况。(用柱状图试试)
#代码编写
# 1表示生存,0表示死亡
pclass_person = result.groupby(["Pclass","Survived"])["Survived"].count()
pclass_person
Pclass  Survived
1       0            80
        1           136
2       0            97
        1            87
3       0           372
        1           119
Name: Survived, dtype: int64
pclass_person.unstack().plot(kind = "bar", stacked = True)
pclass_person.unstack().plot(kind = "bar")
【思考】看到这个前面几个数据可视化,说说你的第一感受和你的总结
思考题回答:
女性存活人数以及存活率均高于男性
1级客舱的存活率最高;3级客舱的人数最多但存活率最低
2.7.6 任务六:可视化展示泰坦尼克号数据集中不同年龄的人生存与死亡人数分布情况。(不限表达方式)
#代码编写
age_person = result.groupby(["Age","Survived"])["Survived"].count().unstack()
age_person
| Survived | 0 | 1 |
|---|---|---|
| Age | ||
| 0.42 | NaN | 1.0 |
| 0.67 | NaN | 1.0 |
| 0.75 | NaN | 2.0 |
| 0.83 | NaN | 2.0 |
| 0.92 | NaN | 1.0 |
| ... | ... | ... |
| 70.00 | 2.0 | NaN |
| 70.50 | 1.0 | NaN |
| 71.00 | 2.0 | NaN |
| 74.00 | 1.0 | NaN |
| 80.00 | NaN | 1.0 |
88 rows × 2 columns
age_person.plot(kind = "bar", figsize = (20,5), grid = True)
2.7.7 任务七:可视化展示泰坦尼克号数据集中不同仓位等级的人年龄分布情况。(用折线图试试)
#代码编写
result.Age[result.Pclass == 1].plot(kind='kde', label ="1")
result.Age[result.Pclass == 2].plot(kind='kde', label ="2")
result.Age[result.Pclass == 3].plot(kind='kde', label ="3")
plt.legend()
sex_pclass = result.groupby(["Pclass", "Sex"])["Sex"].count().unstack()
sex_pclass
| Sex | female | male |
|---|---|---|
| Pclass | ||
| 1 | 94 | 122 |
| 2 | 76 | 108 |
| 3 | 144 | 347 |
sex_pclass.plot(kind = "bar", stacked = True)
【思考】上面所有可视化的例子做一个总体的分析,你看看你能不能有自己发现
【补充】核密度图
核密度图本质是直方图的拟合曲线。
- “峰”越高,表示此处数据越“密集”。
- kernel曲线向右移动:XX水平不断提高。
- 分布形态:右尾拉长,表示差异增加。
- 多峰:多峰形态明显,说明多极分化现象。双峰向单峰过渡,说明两极分化现象在减弱。
- 扁而宽的核密度曲线(峰值降低、宽度加大)表示差异程度变大。
- 若核密度曲线图中, 波形向左移动 (呈右偏态分布) 、波峰垂直高度上升、水平宽度减小、波峰数量减小, 则表明其核密度趋于向数值减小的方向移动。
思考题回答:
通过上述图表,可以发现:
- 10岁以下存活人数高于死亡人数;中年年龄段死亡人数略高于存活人数;高年龄段死亡人数高于存活人数
- 2级舱位以及3级舱位的乘客年龄段比较集中,以10-40岁为主,1级舱位的乘客年龄段相对比较平均
- 1级舱位以及2级舱位的女性乘客占比远高于3级客舱
在这之前,我们也有部分观察结论:
- 男性的存活率低于女性存活率
- 1级客舱的存活率最高;3级客舱的人数最多但存活率最低
【总结】到这里,我们的可视化就告一段落啦,如果你对数据可视化极其感兴趣,你还可以了解一下其他可视化模块,如:pyecharts,bokeh等。
如果你在工作中使用数据可视化,你必须知道数据可视化最大的作用不是炫酷,而是最快最直观的理解数据要表达什么,你觉得呢?


