gdal不支持fgdbr格式_Python | GDAL处理矢量数据
GDAL矢量数据处理
为什么要学GDAL?
- GDAL是什么?
- (Geospatial Data Abstraction Library)
- 地理空间数据抽象库
- 用C/C++编写,支持多种矢量/栅格数据,支持python、.NET、Ruby等语言绑定,开放源码。
- 传统上GDAL指的是栅格支持库
from osgeo import gdal
- 矢量支持使用OGR简单要素库
- (OpenGIS Simple Features Reference Implementation)
- 但由于OGR与OpenGIS的规范并不完全一样,所以名字被改了。现在OGR部分并不代表任何东西,只是历史延续。
from osgeo import ogr
- GDAL/OGR两者捆绑安装,是最流行的地理数据开源库,直接pip install gdal 或者conda install gdal就可以啦!
常见矢量数据
- Shapefile
- 存储矢量数据的一种通用格式
- 至少需要3个单独的二进制文件
- 几何信息存储在shp和shx文件中
- 属性信息存储在dbf文件中
- 索引或空间参考还有单独的文件
- 必须保证这些二进制文件都在同一个文件夹中
- GeoJSON
- 纯文本,可用记事本或其它文本编辑器打开
- 单一文件
- 关系数据库
- 文件地理数据库 file geodatabase
- 与上面两种完全不同,它不是现有数据库系统的一部分
- PostgreSQL数据库:PostGIS空间扩展
- SQLite数据库:SpatiaLite空间扩展
- 支持多用户访问
- 支持各种类型的索引
- 内置了空间扩展的数据库系统
- Esri的数据库
矢量数据的读取
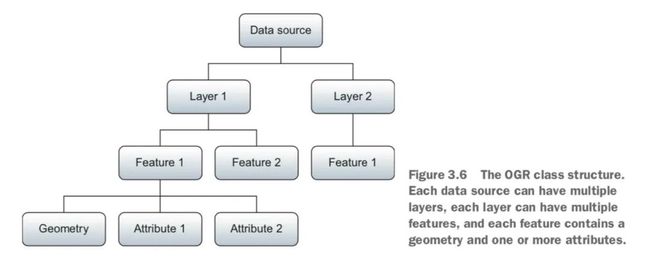
- OGR类的结构:
- 数据源->图层layer->要素feature->属性attribute
- 每种格式的数据都有相应的驱动,有的驱动支持读写,有的是只读的。操作数据之前需要加载相应的驱动
# 导入ogr,注意导入的名称from osgeo import ogr# 载入GeoJSON驱动driver = 0.GetDriverByName('GeoJSON')print(driver) ># 不分大小写,这样写也行driver = ogr.GetDriverByName('geojson')print(driver) >driver2 = ogr.GetDriverByName('Esri shapefile')print(driver2)
>
# 从shapefile中读取点要素,以城市人口数据为例import sysfrom osgeo import ogr# 打开数据源,打开图层fn = 'E:/公众号/python/2/osgeopy-data/global/ne_50m_populated_places.shp'# ogr.Open函数,打开数据源,注意Open的O是大写# 根据文件类型,Open函数自动载入驱动# 第一个参数是shapefile的文件名# 第二个参数update =0:只读,=1:读写# 如果文件无法打开,ds is None,注意错误处理# 如果文件打开正确,返回数据源ds(data source)ds = ogr.Open(fn, 0)if ds is None: sys.exit('Could not open {0}.'.format(fn)) # 一个数据源包括多个图层,用GetLayer(n)函数返回索引为n的图层,该参数默认值为0lyr = ds.GetLayer(0)i = 0# 循环读取每个要素for feat in lyr: # 读取x和y方向的坐标 pt = feat.geometry() x = pt.GetX() y = pt.GetY() # 读取属性值 name = feat.GetField('NAME') pop = feat.GetField('POP_MAX') print(name, pop, x, y) i += 1 if i == 10: breakdel dsBombo 75000 32.533299524864844 0.5832991056146284
Fort Portal 42670 30.27500161597942 0.671004121125236
Potenza 69060 15.798996495640267 40.642002130098206
Campobasso 50762 14.655996558921856 41.56299911864397
Aosta 34062 7.315002595706176 45.7370010670723
Mariehamn 10682 19.949004471869102 60.09699618489543
Ramallah 24599 35.206209378189556 31.90294475142406
Vatican City 832 12.453386544971766 41.903282179960115
Poitier 85960 0.3332765285345545 46.58329225573658
Clermont-Ferrand 233050 3.080008095928406 45.779982115759424
获取要素信息
- 每个图层包括一个或多个要素
- 每个要素表示一个地理对象,也是一个python对象,用dir()函数获取该对象的所有属性
- 读取属性信息feat.GetField('Name’)
- 列出所有属性feat.keys()
- 读取几何信息pt = feat.geometry()
# 打开shp文件data_dir = 'E:/公众号/python/2/osgeopy-data/'fn = os.path.join(data_dir, 'global', 'ne_50m_poplated_places.shp')# 根据文件类型,Open函数会自动载入驱动ds = ogr.Open(fn, 0)if ds is None: sys.exit('Could not open {0}.'.format(fn))lyr = ds.GetLayer(0)# Get the total number of features and the last one.# 载入要素的总数num_features = lyr.GetFeatureCount()print(num_features)# 获取最后一个要素, 按索引值访问要素last_feature = lyr.GetFeature(num_features - 1)print(last_feature.NAME)1249
Hong Kong
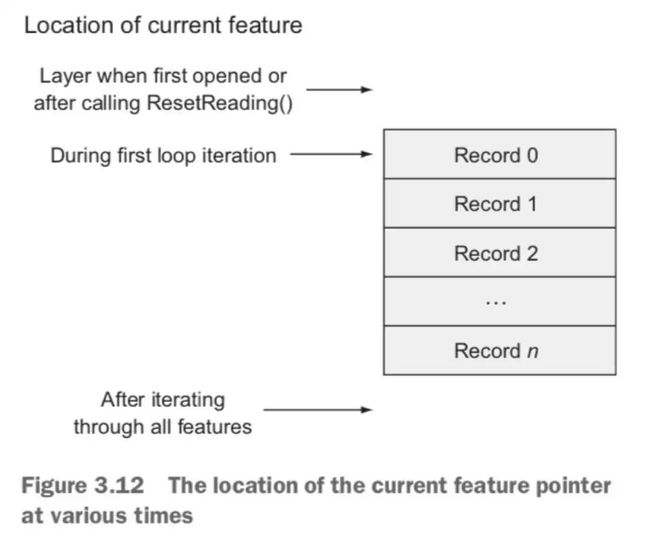
# 注意:会记得最后访问的要素对象(称为当前要素)下次读取会从当前要素之后开始读# 使用lyr.ResetReading()重置当前要素# 如果循环两遍,却没有重置,则第二遍不会打印任何东西fn = os.path.join(data_dir, 'Washington', 'large_cities.geojson')ds = ogr.Open(fn, 0)lyr = ds.GetLayer(0)print('First loop')for feat in lyr: print(feat.GetField('Name'), feat.GetField('Population'))print('Second loop')for feat in lyr: pt = feat.geometry() print(feat.GetField('Name'), pt.GetX(), pt.GetY())First loop
Bellingham 67171
Everett 91488
Shoreline 53025
Seattle 563374
Bellevue 109569
Renton 50052
Kent 79524
Federal Way 83259
Tacoma 193556
Spokane 195629
Yakima 71845
Vancouver 143560
Kennewick 54693
Second loop
- 要素列表用for循环遍历一次之后,再遍历第二次会返回空列表
- 为什么?(当前要素是最后一个要素,后面没了)
- 如何处理?(使用lyr.ResetReading()重置)
# 重置之后,正常执行下一个循环ds = ogr.Open(fn, 0)lyr = ds.GetLayer(0)print('First loop')for feat in lyr: print(feat.GetField('Name'), feat.GetField('Population'))print('Second loop')lyr.ResetReading() # This is the important line.for feat in lyr: pt = feat.geometry() print(feat.GetField('Name'), pt.GetX(), pt.GetY())First loop
Bellingham 67171
Everett 91488
Shoreline 53025
Seattle 563374
Bellevue 109569
Renton 50052
Kent 79524
Federal Way 83259
Tacoma 193556
Spokane 195629
Yakima 71845
Vancouver 143560
Kennewick 54693
Second loop
Bellingham -122.48822021484375 48.759552001953125
Everett -122.20207214355469 47.97898864746094
Shoreline -122.34152221679688 47.75564956665039
Seattle -122.33206939697266 47.6062126159668
Bellevue -122.20067596435547 47.610382080078125
Renton -122.2170639038086 47.482879638671875
Kent -122.2348403930664 47.38093185424805
Federal Way -122.31262969970703 47.32231903076172
Tacoma -122.44429779052734 47.25288009643555
Spokane -117.4260482788086 47.658782958984375
Yakima -120.50589752197266 46.60206604003906
Vancouver -122.66148376464844 45.638729095458984
Kennewick -119.1372299194336 46.211246490478516
获取数据的元数据
- 什么是元数据?
- 数据的数据,关于数据集的基本信息
- 例如:要素数量、空间范围、几何类型、空间参考系统、属性字段的名称和类型 等等
- 获取方式:使用GetXXXX系列方法获取
# Open the large_cities data source.fn = os.path.join(data_dir, 'Washington', 'large_cities.geojson')ds = ogr.Open(fn)if ds is None: sys.exit('Could not open {0}.'.format(fn))# 读取空间范围lyr = ds.GetLayer(0)extent = lyr.GetExtent()print(extent)print('Upper left corner: {}, {}'.format(extent[0], extent[3]))print('Lower right corner: {}, {}'.format(extent[1], extent[2]))(-122.66148376464844, -117.4260482788086, 45.638729095458984, 48.759552001953125)
Upper left corner: -122.66148376464844, 48.759552001953125
Lower right corner: -117.4260482788086, 45.638729095458984
# 读取几何要素类型print(lyr.GetGeomType())print(lyr.GetGeomType() == ogr.wkbPoint)print(lyr.GetGeomType() == ogr.wkbPolygon)1
True
False
# 几何要素类型,易读模式feat = lyr.GetFeature(0)print(feat.geometry().GetGeometryName())POINT
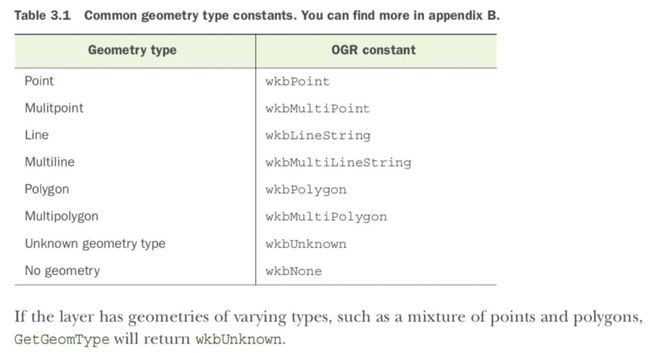
- 图层的几何类型可以用lyr.GetGeomType()查看
- 但是这个函数返回整数值,不很直观
- GetGeometryName()函数可以查看几何类型的名称,但是要注意调用方式
- 对于要素,有唯一的几何类型
- 对于图层,如果其中的要素的几何类型不唯一,返回wkbUnknown
- 常见几何类型
# 读取空间参考print(lyr.GetSpatialRef())GEOGCS["NAD83",
DATUM["North_American_Datum_1983",
SPHEROID["GRS 1980",6378137,298.257222101,
AUTHORITY["EPSG","7019"]],
TOWGS84[0,0,0,0,0,0,0],
AUTHORITY["EPSG","6269"]],
PRIMEM["Greenwich",0,
AUTHORITY["EPSG","8901"]],
UNIT["degree",0.0174532925199433,
AUTHORITY["EPSG","9122"]],
AUTHORITY["EPSG","4269"]]
# 读取字段名称和类型 for field in lyr.schema: print(field.name, field.GetTypeName())CITIESX020 Integer
FEATURE String
NAME String
POP_RANGE String
POPULATION Integer
FIPS55 String
COUNTY String
FIPS String
STATE String
STATE_FIPS String
DISPLAY Integer
矢量数据写入
- 读取矢量数据(包括空间和属性信息),然后可以用python丰富的科学计算库分析数据,得出科学结论
- 有时候也需要自己生产数据,生成shapefile供其他GIS系统读写
- 生产数据可以在有GUI的GIS系统中手工操作,也可以通过编程语言批量操作
- 用python的优点:编程简单,批量操作
写入矢量数据的步骤
- 打开一个文件夹作为数据源,而不是shapefile文件
- 如果文件夹中大部分是shapefile文件,每个shapefile文件会被视为一个图层
- ogr.Open(fn,1)以写入模式打开数据源
- OGR不会覆盖现有图层,你需要先删除同名图层
- ds.CreateLayer(name)创建新图层
- 语法:
ds.CreateLayer(name,[srs],[geom_type],[options]) - name:图层,即shapefile名称(不含扩展名)
- srs:空间参考系统,默认为None(没有参考)
- geom_type:几何类型常量,默认为wkbUnknown
- options:图层创建时的选项列表,只适用于特定数据类型
- 语法:
- 为新图层添加要素
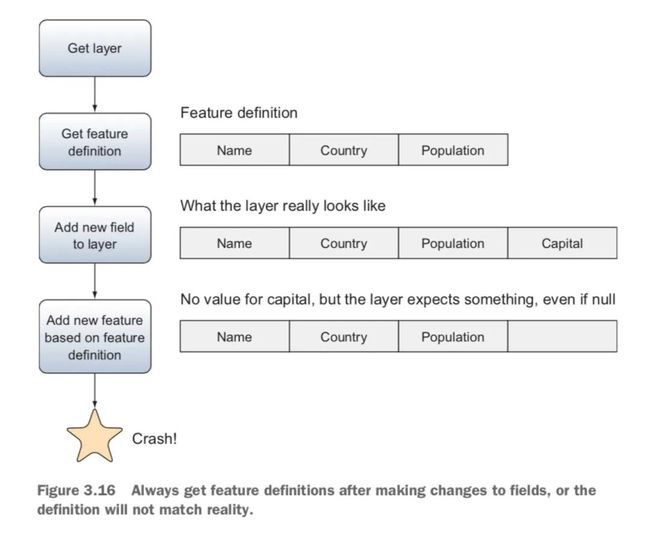
- 创建一个虚拟的空要素,用于存储几何要素和属性
- 创建要素需要获得要素定义,其包含的几何类型和所有属性字段的信息
- 需要该图层的要素定义信息,但是你必须在图层做了添加、删除或更新之后进行获取
- 如果先获取图层信息,后插入,基于过时信息插入的要素,会与事实不符,导致python崩溃
# 将一个shp文件中的要素写入另一个文件import sysfrom osgeo import ogr# 打开数据源,注意update参数设置为1,表示可读可写 # 这一次的数据源是文件夹,不是文件,在该文件夹下创建新的shp文件 ds = ogr.Open(data_dir+'/global', 1)if ds is None: sys.exit('Could not open folder.')# 将已有的shp文件视作图层,读取 in_lyr = ds.GetLayer('ne_50m_populated_places')# 新建图层,如果同名图层已经存在,先把它删掉 if ds.GetLayer('capital_cities'): ds.DeleteLayer('capital_cities')# 以后使用图层时,建议引用图层名称而不是索引,写入新图层后,索引会变化 # 新建图层,设定图层名称,空间参考,类型 out_lyr = ds.CreateLayer('capital_cities', in_lyr.GetSpatialRef(), ogr.wkbPoint)# 新建图层的属性字段定义列表,将其设定为和源图层一模一样 out_lyr.CreateFields(in_lyr.schema)# 新建空的要素 out_defn = out_lyr.GetLayerDefn()out_feat = ogr.Feature(out_defn)for in_feat in in_lyr: # 如果FEATURECLA属性为‘Admin-0 capital’ 则进行以下操作 if in_feat.GetField('FEATURECLA') == 'Admin-0 capital': # Copy geometry and attributes # 复制几何信息 geom = in_feat.geometry() out_feat.SetGeometry(geom) # 复制属性信息 for i in range(in_feat.GetFieldCount()): value = in_feat.GetField(i) out_feat.SetField(i, value) # 插入要素CreateFeature() out_lyr.CreateFeature(out_feat) # 插入要素之后,该要素的信息就会写入图层对象。out_feat对象可以重复使用,不会影响已经写入的信息。# 最后需要保证写入的信息同步到文件中 # 强制关闭数据源:del ds# 或者使用同步函数,不关闭数据源 # 一定要及时的同步,否则会造成写入
创建一个新的数据源
- 如何从无到有的创建新的数据源,而不是写入到已有的数据源?
- 从已有数据源提取驱动程序,用同一个驱动创建同样格式的数据源。
- 载入指定名称的驱动程序,然后创建数据源
# 创建一个新的数据源,而不是写入到已有的数据源 # 从已有数据源提取驱动程序 ds = ogr.Open(os.path.join(data_dir, 'global', 'ne_50m_admin_0_countries.shp'))driver = ds.GetDriver()print(driver.name)ESRI Shapefile
# 载入指定名称的驱动程序 json_driver = ogr.GetDriverByName('GeoJSON')print(json_driver.name)# 创建GeoJSON数据源 # 注意这个文件夹必须要首先存在,ogr不会自动创建文件夹 json_fn = os.path.join(data_dir, 'output', 'example.geoson')json_ds = json_driver.CreateDataSource(json_fn)if json_ds is None: sys.exit('Could not create {0}.'.format(json_fn))GeoJSON
# 如果数据源已经存在,先删掉它 if os.path.exists(json_fn): json_driver.DeleteDataSource(json_fn)# 创建SQLite数据库 driver = ogr.GetDriverByName('SQLite')ds = driver.CreateDataSource(os.path.join(data_dir, 'out-put', 'earth.sqlite'), ['SPATIALITE=yes'])# 使用ogr的抛出异常功能ogr.UseExceptions(fn = os.path.join(data_dir, 'output', 'africa.geojson')driver = ogr.GetDriverByName('GeoJSON')print('Doing some preliminary analysis...')try: # 如果文件已经存在,会抛出异常 ds = driver.CreateDataSource(fn) lyr = ds.CreateLayer('layer') except RuntimeError as e: # 在这里处理异常 print(e)print('Doing some more analysis...')Doing some preliminary analysis...
Doing some more analysis...
创建和修改字段
- 创建字段定义:
ogr.FieldDefn()coord_fld = ogr.FieldDefn('X_short', ogr.OFTReal)
- 修改字段定义:
coord_fld.SetXXXX()coord_fld.SetWidth(8)coord_fld.SetPrecision(3)
- 根据字段定义创建字段:
lyr.CreateField(fld)out_lyr.CreateField(coord_fld)
- 同一个字段定义,可以改改名字和属性,再创建别的字段
coord_fld.SetName('Y_short')out_lyr.CreateField(coord_fld)
- 字段类型常量
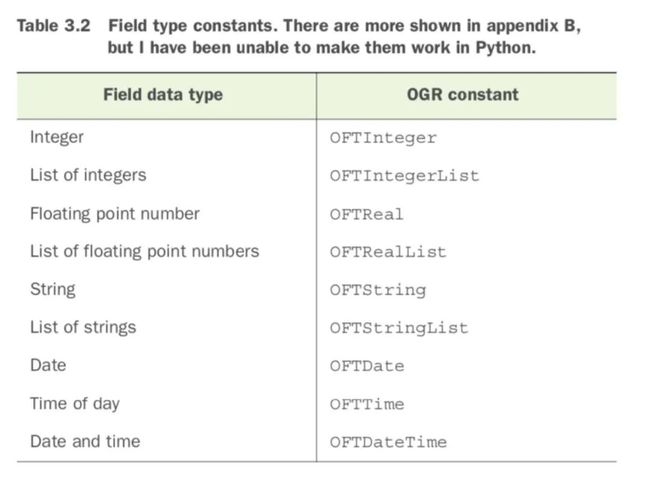
# 打开输入的shp文件,创建输出的shp文件,和以前类似 in_fn = os.path.join(data_dir, 'Washington', 'large_cities.shp')in_ds = ogr.Open(in_fn, 0)if in_ds is None: sys.exit('Could not open {0}.'.format(in_fn))in_lyr = in_ds.GetLayer(0)driver = in_ds.GetDriver()out_fn = os.path.join(data_dir, 'output', 'precision_test.shp')if os.path.exists(out_fn): driver.DeleteDataSource(out_fn)out_ds = driver.CreateDataSource(out_fn)if out_ds is None: sys.exit('Could not create {0}.'.format(out_fn))out_lyr = out_ds.CreateLayer('precision_test', in_lyr.GetSpatialRef(), ogr.wkbPoint)# 使用FieldDefn创建字段定义 name_fld = ogr.FieldDefn('Name', ogr.OFTString)# 使用SetXXXX系列函数改变字段的设置 name_fld.SetWidth(6)# 使用CreateField创建字段 out_lyr.CreateField(name_fld)# 用默认的精度创建两个字段,这两个字段只是名字不一样,用SetName改字段定义的名字 coord_fld = ogr.FieldDefn('X_default', ogr.OFTReal)out_lyr.CreateField(coord_fld)coord_fld.SetName('Y_default')out_lyr.CreateField(coord_fld)# 创建两个字段,修改精度(其实是降低了精度) coord_fld = ogr.FieldDefn('X_short', ogr.OFTReal)coord_fld.SetWidth(8)coord_fld.SetPrecision(3)out_lyr.CreateField(coord_fld)coord_fld.SetName('Y_short')out_lyr.CreateField(coord_fld)# 将数据复制进去。用QGIS或者ArcGIS打开文件,看看里面的内容 out_feat = ogr.Feature(out_lyr.GetLayerDefn())for in_feat in in_lyr: pt = in_feat.geometry() name = in_feat.GetField('NAME') out_feat.SetGeometry(in_feat.geometry()) out_feat.SetField('Name', name) out_feat.SetField('X_default', pt.GetX()) out_feat.SetField('Y_default', pt.GetY()) out_feat.SetField('X_short', pt.GetX()) out_feat.SetField('Y_short', pt.GetY()) out_lyr.CreateFeature(out_feat)改变现有图层的定义
- 使用函数
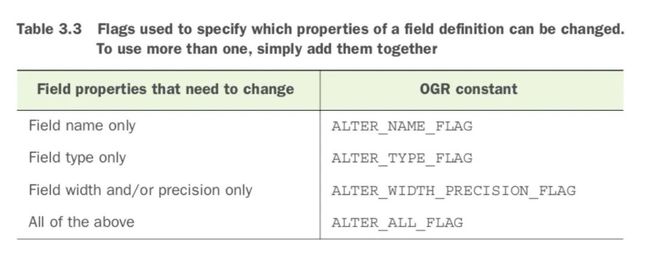
lyr.AlterFieldDefn(i, fld_defn, ogr.FLAG)- i:要修改的属性字段的编号
- fld_defn:字段定义
- FLAG:一个OGR常量,表示你想如何修改
- 改变图层定义需要的OGR常量
original_fn = os.path.join(data_dir, 'Washington', 'large_cities.shp')new_fn = os.path.join(data_dir, 'output', 'large_cities2.shp')# 将原始文件复制一份 pb.copy_datasource(original_fn, new_fn)ds = ogr.Open(new_fn, 1)if ds is None: sys.exit('Could not open {0}.'.format(new_fn))lyr = ds.GetLayer(0)# 查看一下属性print('Original attributes')pb.print_attributes(lyr, geom=True)Original attributes
FID Geometry CITIESX020 FEATURE NAME POP_RANGE POP_2000 FIPS55 COUNTY FIPS STATE STATE_FIPS DISPLAY
0 POINT (-122.488, 48.760) 404 County Seat Bellingham 50,000 - 99,999 67171 05280 Whatcom County 53073 WA 53 0
1 POINT (-122.202, 47.979) 538 County Seat Everett 50,000 - 99,999 91488 22640 Snohomish County 53061 WA 53 0
2 POINT (-122.342, 47.756) 613 Populated Place Shoreline 50,000 - 99,999 53025 63960 King County 53033 WA 53 0
3 POINT (-122.332, 47.606) 685 County Seat Seattle 500,000 - 999,999 563374 63000 King County 53033 WA 53 0
4 POINT (-122.201, 47.610) 697 Populated Place Bellevue 100,000 - 249,999 109569 05210 King County 53033 WA 53 0
5 POINT (-122.217, 47.483) 776 Populated Place Renton 50,000 - 99,999 50052 57745 King County 53033 WA 53 0
6 POINT (-122.235, 47.381) 838 Populated Place Kent 50,000 - 99,999 79524 35415 King County 53033 WA 53 0
7 POINT (-122.313, 47.322) 870 Populated Place Federal Way 50,000 - 99,999 83259 23515 King County 53033 WA 53 0
8 POINT (-122.444, 47.253) 896 County Seat Tacoma 100,000 - 249,999 193556 70000 Pierce County 53053 WA 53 0
9 POINT (-117.426, 47.659) 1184 County Seat Spokane 100,000 - 249,999 195629 67000 Spokane County 53063 WA 53 0
10 POINT (-120.506, 46.602) 1594 County Seat Yakima 50,000 - 99,999 71845 80010 Yakima County 53077 WA 53 0
11 POINT (-122.661, 45.639) 2035 County Seat Vancouver 100,000 - 249,999 143560 74060 Clark County 53011 WA 53 0
12 POINT (-119.137, 46.211) 2103 Populated Place Kennewick 50,000 - 99,999 54693 35275 Benton County 53005 WA 53 0
13 of 13 features
# 新建一个字段定义,使用AlterFieldDefn函数修改已存在的图层中的字段# 将字段名从Name改为City_Namei = lyr.GetLayerDefn().GetFieldIndex('Name')fld_defn = ogr.FieldDefn('City_Name', ogr.OFTString)lyr.AlterFieldDefn(i, fld_defn, ogr.ALTER_NAME_FLAG)# 查看一下属性print('Modified attributes')pb.print_attributes(lyr, geom=True)Modified attributes
FID Geometry CITIESX020 FEATURE City_Name POP_RANGE POP_2000 FIPS55 COUNTY FIPS STATE STATE_FIPS DISPLAY
0 POINT (-122.488, 48.760) 404 County Seat Bellingham 50,000 - 99,999 67171 05280 Whatcom County 53073 WA 53 0
1 POINT (-122.202, 47.979) 538 County Seat Everett 50,000 - 99,999 91488 22640 Snohomish County 53061 WA 53 0
2 POINT (-122.342, 47.756) 613 Populated Place Shoreline 50,000 - 99,999 53025 63960 King County 53033 WA 53 0
3 POINT (-122.332, 47.606) 685 County Seat Seattle 500,000 - 999,999 563374 63000 King County 53033 WA 53 0
4 POINT (-122.201, 47.610) 697 Populated Place Bellevue 100,000 - 249,999 109569 05210 King County 53033 WA 53 0
5 POINT (-122.217, 47.483) 776 Populated Place Renton 50,000 - 99,999 50052 57745 King County 53033 WA 53 0
6 POINT (-122.235, 47.381) 838 Populated Place Kent 50,000 - 99,999 79524 35415 King County 53033 WA 53 0
7 POINT (-122.313, 47.322) 870 Populated Place Federal Way 50,000 - 99,999 83259 23515 King County 53033 WA 53 0
8 POINT (-122.444, 47.253) 896 County Seat Tacoma 100,000 - 249,999 193556 70000 Pierce County 53053 WA 53 0
9 POINT (-117.426, 47.659) 1184 County Seat Spokane 100,000 - 249,999 195629 67000 Spokane County 53063 WA 53 0
10 POINT (-120.506, 46.602) 1594 County Seat Yakima 50,000 - 99,999 71845 80010 Yakima County 53077 WA 53 0
11 POINT (-122.661, 45.639) 2035 County Seat Vancouver 100,000 - 249,999 143560 74060 Clark County 53011 WA 53 0
12 POINT (-119.137, 46.211) 2103 Populated Place Kennewick 50,000 - 99,999 54693 35275 Benton County 53005 WA 53 0
13 of 13 features
# 同时改变字段的多个属性(例如同时更改名称和精度) lyr_defn = lyr.GetLayerDefn()i = lyr_defn.GetFieldIndex('POP_2000')width = lyr_defn.GetFieldDefn(i).GetWidth()fld_defn = ogr.FieldDefn('POP_2000x', ogr.OFTReal)fld_defn.SetWidth(width)fld_defn.SetPrecision(4)flag = ogr.ALTER_NAME_FLAG + ogr.ALTER_WIDTH_PRECISION_FLAGlyr.AlterFieldDefn(i, fld_defn, flag)# 查看一下属性 print('Modified attributes')pb.print_attributes(lyr, geom=True)Modified attributes
FID Geometry CITIESX020 FEATURE City_Name POP_RANGE POP_2000x FIPS55 COUNTY FIPS STATE STATE_FIPS DISPLAY
0 POINT (-122.488, 48.760) 404 County Seat Bellingham 50,000 - 99,999 67171 05280 Whatcom County 53073 WA 53 0
1 POINT (-122.202, 47.979) 538 County Seat Everett 50,000 - 99,999 91488 22640 Snohomish County 53061 WA 53 0
2 POINT (-122.342, 47.756) 613 Populated Place Shoreline 50,000 - 99,999 53025 63960 King County 53033 WA 53 0
3 POINT (-122.332, 47.606) 685 County Seat Seattle 500,000 - 999,999 563374 63000 King County 53033 WA 53 0
4 POINT (-122.201, 47.610) 697 Populated Place Bellevue 100,000 - 249,999 109569 05210 King County 53033 WA 53 0
5 POINT (-122.217, 47.483) 776 Populated Place Renton 50,000 - 99,999 50052 57745 King County 53033 WA 53 0
6 POINT (-122.235, 47.381) 838 Populated Place Kent 50,000 - 99,999 79524 35415 King County 53033 WA 53 0
7 POINT (-122.313, 47.322) 870 Populated Place Federal Way 50,000 - 99,999 83259 23515 King County 53033 WA 53 0
8 POINT (-122.444, 47.253) 896 County Seat Tacoma 100,000 - 249,999 193556 70000 Pierce County 53053 WA 53 0
9 POINT (-117.426, 47.659) 1184 County Seat Spokane 100,000 - 249,999 195629 67000 Spokane County 53063 WA 53 0
10 POINT (-120.506, 46.602) 1594 County Seat Yakima 50,000 - 99,999 71845 80010 Yakima County 53077 WA 53 0
11 POINT (-122.661, 45.639) 2035 County Seat Vancouver 100,000 - 249,999 143560 74060 Clark County 53011 WA 53 0
12 POINT (-119.137, 46.211) 2103 Populated Place Kennewick 50,000 - 99,999 54693 35275 Benton County 53005 WA 53 0
13 of 13 features
# 使用copy方法拷贝字段定义,可以避免一些奇怪的错误import copylyr_defn = lyr.GetLayerDefn()i = lyr_defn.GetFieldIndex('POP_2000x')fld_defn = copy.copy(lyr_defn.GetFieldDefn(i))fld_defn.SetName('POP_2000xx')fld_defn.SetPrecision(4)flag = ogr.ALTER_NAME_FLAG + ogr.ALTER_WIDTH_PRECISION_FLAGlyr.AlterFieldDefn(i, fld_defn, flag)print('\nNew field names and empty ID field')pb.print_attributes(lyr, geom=False)New field names and empty ID field
FID CITIESX020 FEATURE City_Name POP_RANGE POP_2000xx FIPS55 COUNTY FIPS STATE STATE_FIPS DISPLAY
0 404 County Seat Bellingham 50,000 - 99,999 67171 05280 Whatcom County 53073 WA 53 0
1 538 County Seat Everett 50,000 - 99,999 91488 22640 Snohomish County 53061 WA 53 0
2 613 Populated Place Shoreline 50,000 - 99,999 53025 63960 King County 53033 WA 53 0
3 685 County Seat Seattle 500,000 - 999,999 563374 63000 King County 53033 WA 53 0
4 697 Populated Place Bellevue 100,000 - 249,999 109569 05210 King County 53033 WA 53 0
5 776 Populated Place Renton 50,000 - 99,999 50052 57745 King County 53033 WA 53 0
6 838 Populated Place Kent 50,000 - 99,999 79524 35415 King County 53033 WA 53 0
7 870 Populated Place Federal Way 50,000 - 99,999 83259 23515 King County 53033 WA 53 0
8 896 County Seat Tacoma 100,000 - 249,999 193556 70000 Pierce County 53053 WA 53 0
9 1184 County Seat Spokane 100,000 - 249,999 195629 67000 Spokane County 53063 WA 53 0
10 1594 County Seat Yakima 50,000 - 99,999 71845 80010 Yakima County 53077 WA 53 0
11 2035 County Seat Vancouver 100,000 - 249,999 143560 74060 Clark County 53011 WA 53 0
12 2103 Populated Place Kennewick 50,000 - 99,999 54693 35275 Benton County 53005 WA 53 0
13 of 13 features
增加、修改、删除要素
- 增加和修改要素
- 先修改要素对象
- 使用SetFeature()代替CreateFeature()把改好的要素对象写进图层
- 删除要素
- 指定要素的FID,使用lyr.DeleteFeature()
- 删除之后,需要整理/重组数据库空间
- 删除之后,需要重新计算空间范围
# 增加要素 lyr.ResetReading()lyr.CreateField(ogr.FieldDefn('ID', ogr.OFTInteger))n = 1for feat in lyr: feat.SetField('ID', n) lyr.SetFeature(feat) n += 1print('\nID has been added and precision has taken effect')pb.print_attributes(lyr, geom=False)ID has been added and precision has taken effect
FID CITIESX020 FEATURE City_Name POP_RANGE POP_2000xx FIPS55 COUNTY FIPS STATE STATE_FIPS DISPLAY ID
0 404 County Seat Bellingham 50,000 - 99,999 67171 05280 Whatcom County 53073 WA 53 0 1
1 538 County Seat Everett 50,000 - 99,999 91488 22640 Snohomish County 53061 WA 53 0 2
2 613 Populated Place Shoreline 50,000 - 99,999 53025 63960 King County 53033 WA 53 0 3
3 685 County Seat Seattle 500,000 - 999,999 563374 63000 King County 53033 WA 53 0 4
4 697 Populated Place Bellevue 100,000 - 249,999 109569 05210 King County 53033 WA 53 0 5
5 776 Populated Place Renton 50,000 - 99,999 50052 57745 King County 53033 WA 53 0 6
6 838 Populated Place Kent 50,000 - 99,999 79524 35415 King County 53033 WA 53 0 7
7 870 Populated Place Federal Way 50,000 - 99,999 83259 23515 King County 53033 WA 53 0 8
8 896 County Seat Tacoma 100,000 - 249,999 193556 70000 Pierce County 53053 WA 53 0 9
9 1184 County Seat Spokane 100,000 - 249,999 195629 67000 Spokane County 53063 WA 53 0 10
10 1594 County Seat Yakima 50,000 - 99,999 71845 80010 Yakima County 53077 WA 53 0 11
11 2035 County Seat Vancouver 100,000 - 249,999 143560 74060 Clark County 53011 WA 53 0 12
12 2103 Populated Place Kennewick 50,000 - 99,999 54693 35275 Benton County 53005 WA 53 0 13
13 of 13 features
# 删除要素,例如删除名称为西雅图的城市lyr.ResetReading()for feat in lyr: if feat.GetField('City_Name') == 'Seattle': lyr.DeleteFeature(feat.GetFID())print('\nSeattle deleted')pb.print_attributes(lyr, geom=False)# 删除之后需要整理/重组数据库空间,并重新计算空间范围ds.ExecuteSQL('REPACK ' + lyr.GetName())ds.ExecuteSQL('RECOMPUTE EXTENT ON ' + lyr.GetName())print('\nDatabase packed')pb.print_attributes(lyr, geom=False)Seattle deleted
FID CITIESX020 FEATURE City_Name POP_RANGE POP_2000xx FIPS55 COUNTY FIPS STATE STATE_FIPS DISPLAY ID
0 404 County Seat Bellingham 50,000 - 99,999 67171 05280 Whatcom County 53073 WA 53 0 1
1 538 County Seat Everett 50,000 - 99,999 91488 22640 Snohomish County 53061 WA 53 0 2
2 613 Populated Place Shoreline 50,000 - 99,999 53025 63960 King County 53033 WA 53 0 3
3 697 Populated Place Bellevue 100,000 - 249,999 109569 05210 King County 53033 WA 53 0 5
4 776 Populated Place Renton 50,000 - 99,999 50052 57745 King County 53033 WA 53 0 6
5 838 Populated Place Kent 50,000 - 99,999 79524 35415 King County 53033 WA 53 0 7
6 870 Populated Place Federal Way 50,000 - 99,999 83259 23515 King County 53033 WA 53 0 8
7 896 County Seat Tacoma 100,000 - 249,999 193556 70000 Pierce County 53053 WA 53 0 9
8 1184 County Seat Spokane 100,000 - 249,999 195629 67000 Spokane County 53063 WA 53 0 10
9 1594 County Seat Yakima 50,000 - 99,999 71845 80010 Yakima County 53077 WA 53 0 11
10 2035 County Seat Vancouver 100,000 - 249,999 143560 74060 Clark County 53011 WA 53 0 12
11 2103 Populated Place Kennewick 50,000 - 99,999 54693 35275 Benton County 53005 WA 53 0 13
12 of 12 features
Database packed
FID CITIESX020 FEATURE City_Name POP_RANGE POP_2000xx FIPS55 COUNTY FIPS STATE STATE_FIPS DISPLAY ID
0 404 County Seat Bellingham 50,000 - 99,999 67171 05280 Whatcom County 53073 WA 53 0 1
1 538 County Seat Everett 50,000 - 99,999 91488 22640 Snohomish County 53061 WA 53 0 2
2 613 Populated Place Shoreline 50,000 - 99,999 53025 63960 King County 53033 WA 53 0 3
3 697 Populated Place Bellevue 100,000 - 249,999 109569 05210 King County 53033 WA 53 0 5
4 776 Populated Place Renton 50,000 - 99,999 50052 57745 King County 53033 WA 53 0 6
5 838 Populated Place Kent 50,000 - 99,999 79524 35415 King County 53033 WA 53 0 7
6 870 Populated Place Federal Way 50,000 - 99,999 83259 23515 King County 53033 WA 53 0 8
7 896 County Seat Tacoma 100,000 - 249,999 193556 70000 Pierce County 53053 WA 53 0 9
8 1184 County Seat Spokane 100,000 - 249,999 195629 67000 Spokane County 53063 WA 53 0 10
9 1594 County Seat Yakima 50,000 - 99,999 71845 80010 Yakima County 53077 WA 53 0 11
10 2035 County Seat Vancouver 100,000 - 249,999 143560 74060 Clark County 53011 WA 53 0 12
11 2103 Populated Place Kennewick 50,000 - 99,999 54693 35275 Benton County 53005 WA 53 0 13
12 of 12 features
处理不同的矢量文件
- 矢量文件shapefile
- 遵循开放标准,主流GIS软件都支持
- 文件数量多,必须放在同一个文件夹下
- 文本文件CSV
- 纯文本,可以直接用文本编辑器打开
- 单一文件,列表方式,可用excel处理
- 文本文件GeoJSON
- 纯文本,可以直接用文本编辑器打开
- 单一文件,多个图层(点线面)
- 用一个文件表述复杂的数据结构,便于网络传输
- 文本文件都没有空间索引,不利于数据分析(尤其数据较大时)
- 多用户数据库PostGIS
- 开放源码、功能丰富、性能不错
- 不但可以存储数据,还可以运行多种类型的数据分析,不需要借助其他GIS的软件
- 需要单独搭建数据库,如果进行网络开发,让多个用户通过网络访问数据,PostGIS是很好的选择
- SpatiaLite
- 开放源码的轻量级数据库
- 单一文件,可以网络访问也可以直接拷贝sqlite文件
- Esri 文件地理数据库
- Esri专有的数据类型,OGR可用OpenFileGDB读取
- 写入操作需要Esri的第三方库
- OGR库对不同的数据源自动使用不同的驱动(driver),程序代码都是类似的,触类旁通
OGR命令行工具ogrinfo
- 使用ogrinfo查看数据源的信息
ogrinfo myfile.xxx- 查看文件格式和对应的驱动
- 查看包含的图层及其类型
- 查看其中一个图层的信息汇总(使用-so选项),包括元数据,如范围、空间参考、属性字段表和数据类型
ogrinfo -so myfile.xxx
- 查看FID为1的要素的相关信息(-q表示不输出元数据,-geom=No表示不输出几何信息)
ogrinfo -fid 1 -q -geom=No myfile.xxx
过滤数据
- 完全不“地理”的方式:
- 使用for循环,遍历所有要素,用if条件判断来筛选
- 更加“地理”的方式:
- 设定过滤条件,筛选属性值或者空间坐标符合条件的要素
- 例如,乌鸦的定位问题:
- 一天内所有动物(比如乌鸦)的GPS位置
- 今年冬天在北京市过冬的乌鸦的位置
- 在北京师范大学过冬的乌鸦的位置
- 昨晚来过天使路的乌鸦,白天都去哪儿了
- 属性过滤条件语句:类似于SQL,注意:
- 判断是否相等,用=而不是==
- 条件语句类似于SQL中的WHERE语句
- 语句外面要有引号,语句中有字符串要加引号
- 更多OGR可用的SQL语法,请参考ogr_sqlogr_sql_sqlite
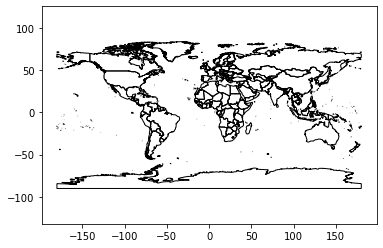
# 过滤数据举例,先画个图ds = ogr.Open(os.path.join(data_dir, 'global'))lyr = ds.GetLayer('ne_50m_admin_0_countries')vp.plot(lyr, fill=False)pb.print_attributes(lyr, 4, ['name'], geom=False)FID name
0 Aruba
1 Afghanistan
2 Angola
3 Anguilla
4 of 241 features
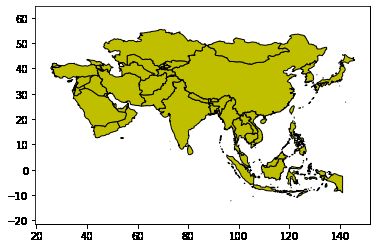
# 按要素属性字段过滤,选择亚洲国家# lyr.SetAttributeFilter('continent = "Asia"') # wrong!lyr.SetAttributeFilter("continent = 'Asia'") # right!lyr.GetFeatureCount()# Draw the Asian countries in yellow and print out a few features.vp.plot(lyr, 'y')pb.print_attributes(lyr, 4, ['name'], geom=False)FID name
1 Afghanistan
7 United Arab Emirates
9 Armenia
17 Azerbaijan
4 of 53 features
# 其他要素都还在,你可以按照FID也就是要素编号选择print(lyr.GetFeature(2).GetField('name'))Angola
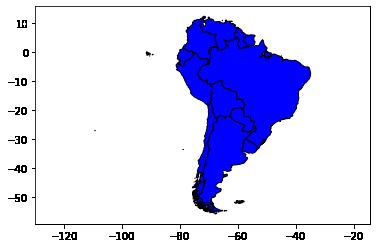
# 新建一个过滤器,这次选南美洲# lyr.SetAttributeFilter('continent = "South America"') # wrong!lyr.SetAttributeFilter("continent = 'South America'") # right!vp.plot(lyr, 'b')lyr.SetAttributeFilter(None)lyr.GetFeatureCount()241
# 空间过滤# 打开数据源,载入数据ds = ogr.Open(os.path.join(data_dir, 'global'))country_lyr = ds.GetLayer('ne_50m_admin_0_countries')vp.plot(country_lyr, fill=False)# 绘制世界城市city_lyr = ds.GetLayer('ne_50m_populated_places')city_lyr.GetFeatureCount()vp.plot(city_lyr, 'y.')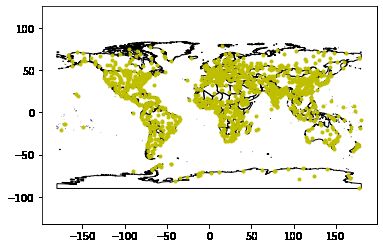
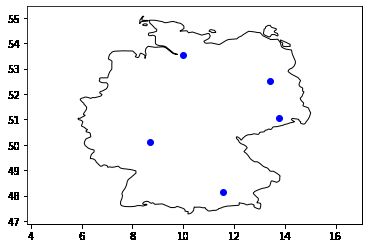
# 创建过滤器,过滤德国country_lyr.SetAttributeFilter("name = 'Germany'")feat = country_lyr.GetNextFeature()germany = feat.geometry().Clone()# 从德国的多边形创建过滤器city_lyr.SetSpatialFilter(germany)print(city_lyr.GetFeatureCount())vp.plot(country_lyr, fill=False)vp.plot(city_lyr, 'bo')5
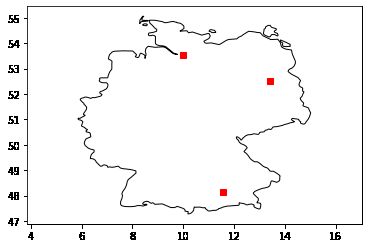
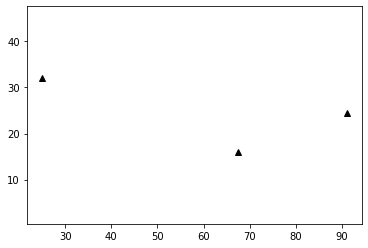
# 再创建一个过滤器,只选择百万人口以上的城市city_lyr.SetAttributeFilter('pop_min > 1000000')print(city_lyr.GetFeatureCount())vp.plot(country_lyr, fill=False)vp.plot(city_lyr, 'rs')3
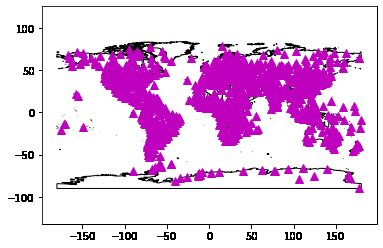
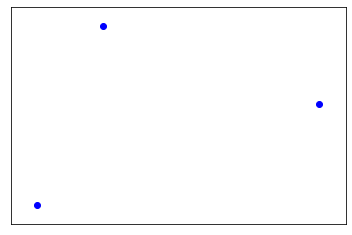
# 去掉过滤器city_lyr.SetSpatialFilter(None)city_lyr.SetAttributeFilter(None)print(city_lyr.GetFeatureCount())country_lyr.SetSpatialFilter(None)country_lyr.SetAttributeFilter(None)print(country_lyr.GetFeatureCount())vp.plot(country_lyr, fill=False)vp.plot(city_lyr, 'm^', markersize=8)1249
241
# 按经纬度范围过滤# 先清除所有过滤器vp.clear() # 清空绘图country_lyr.SetAttributeFilter(None)vp.plot(country_lyr, fill=False)# 设置经纬度范围作为过滤器country_lyr.SetSpatialFilterRect(110, -50, 160, 10)vp.plot(country_lyr, 'y')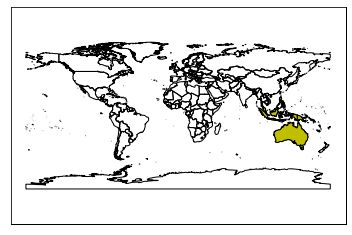
- 为什么需要Clone()克隆?
- 在GDAL/OGR中,不恰当的使用几何对象会导致python崩溃!(而不是抛出一个错误)
- 崩溃的情况源于使用C/C++扩展,故障定位困难,难以调试(类似于C语言的段错误)
- 从要素中得到几何对象,它仍然与该要素相关
- 如果该要素被删除或者被改变,几何对象不再可用
- 如果继续使用该几何对象,python会崩溃
- 应该从源头避免,多用Clone(),存储要素或者几何对象的副本
- 使用SQL创建临时图层
ExecuteSQL(statement, [spatialFilter], [dialect])- statement是使用的SQL语句
- spatialFilter可选的空间过滤器,默认为None
- dialect是SQL语句标准的说明,默认是OGRSQL,在使用SpatiaLite时应该设定为SQLite
- 详细内容从略,各位同学可以参考教材学习。SQL语言是数据库专用的语言,需要很多时间专门学习。
处理几何对象
- 使用python语言,批量输出几何对象,可代替在GIS软件中的要素创建和编辑操作,极大提高数据处理效率
- 下面介绍如何:
- 从零开始创建点、线、面几何对象
- 编辑已经存在的几何要素
GDAL支持的几何要素
- 点存储着坐标值(二维坐标),几何对象均由点构成
- 线是有序的点连成的线段
- 面(多边形)是首尾相连的线围成的区域
- OGR中只有二维坐标X和Y,额外的Z坐标(海拔高程)被认为是2.5D而不是3D
创建点要素
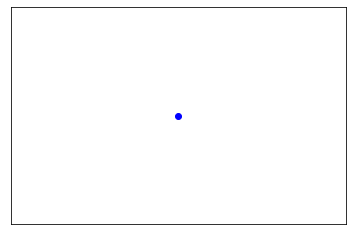
# 创建点要素“火堆”,使用ogr.Geometry函数,设定要素类型为“点”firepit = ogr.Geometry(ogr.wkbPoint)# 设定点的坐标# 向点对象中添加一个点的坐标# 点对象只有一个点坐标# 修改点对象也同样使用AddPoint,原有坐标被覆盖firepit.AddPoint(59.5, 11.5)# 打印出来看看print(firepit)# 可视化vp = VectorPlotter(True)vp.plot(firepit, 'bo')POINT (59.5 11.5 0)
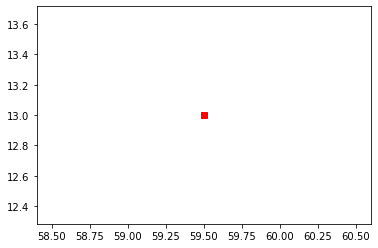
# 修改点的坐标也是用AddPoint函数,原有坐标被覆盖firepit.AddPoint(59.5, 13)vp.plot(firepit, 'rs')print(firepit)POINT (59.5 13.0 0)
# 还可以使用SetPoint函数编辑点的坐标firepit.SetPoint(0, 59.5, 33)print(firepit)POINT (59.5 33.0 0)
# 构造2.5D点对象,加入高程信息firepit = ogr.Geometry(ogr.wkbPoint25D)firepit.AddPoint(59.5, 11.5, 2)print(firepit)POINT (59.5 11.5 2)
用于创建几何类型的OGR常量
- 在ogr.Geometry()函数中输入这些常量作为参数,创建对应类型的几何对象
| Geometry type | 2D constant | 2.5D constant |
|---|---|---|
| Point | wkbPoint | wkbPoint25D |
| Multipoint | wkbMultiPoint | wkbMultiPoint25D |
| Line | wkbLineString | wkbLineString25D |
| Multiline | wkbMultiLineString | wkbMultiLineString25D |
| Polygon ring | wkbLinearRing | n/a |
| Polygon | wkbPolygon | wkbPolygon25D |
| Multipolygon | wkbMultiPolygon | wkbMultiPolygon25D |
| Geometry collection | wkbGeometryCollection | wkbGeometryCollection25D |
多点(Multipoint)
- 多个点几何对象的集合
# 创建多点要素“水龙头”,由多个单点要素合并而成faucets = ogr.Geometry(ogr.wkbMultiPoint)faucet = ogr.Geometry(ogr.wkbPoint)faucet.AddPoint(67.5, 16)faucets.AddGeometry(faucet)faucet.AddPoint(73, 31)faucets.AddGeometry(faucet)faucet.AddPoint(91, 24.5)faucets.AddGeometry(faucet)0
# 可视化vp.clear()vp.plot(faucets, 'bo')vp.zoom(-5)print(faucets)MULTIPOINT (67.5 16.0 0,73 31 0,91.0 24.5 0)
# 更改其中一个点的坐标faucets.GetGeometryRef(1).AddPoint(25, 32)vp.plot(faucets, 'k^', 'tmp')print(faucets)MULTIPOINT (67.5 16.0 0,25 32 0,91.0 24.5 0)
# 批量更改坐标faucets2 = faucets.Clone()for i in range(faucets2.GetGeometryCount()): pt = faucets2.GetGeometryRef(i) pt.AddPoint(pt.GetX() + 2, pt.GetY())# 比较更改前后的坐标vp.plot(faucets, 'bs')vp.plot(faucets2, 'rs')vp.zoom(-5)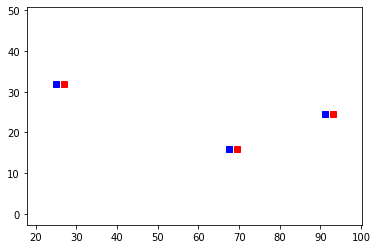
线(Line)
- 多个顶点按顺序依次连接成线
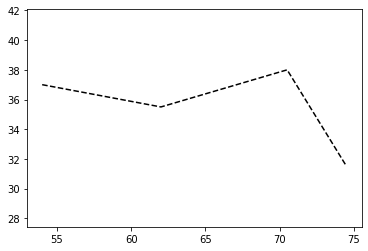
# 创建线要素“人行道”,注意添加点的顺序不能乱sidewalk = ogr.Geometry(ogr.wkbLineString)sidewalk.AddPoint(54, 37)sidewalk.AddPoint(62, 35.5)sidewalk.AddPoint(70.5, 38)sidewalk.AddPoint(74.5, 41.5)# 可视化vp = VectorPlotter(True)vp.plot(sidewalk, 'b-')print(sidewalk)LINESTRING (54 37 0,62.0 35.5 0,70.5 38.0 0,74.5 41.5 0)
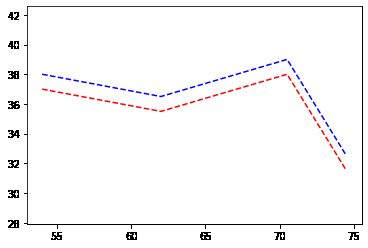
# 更改点的坐标(更改的是3号点) sidewalk.SetPoint(3, 74.5, 31.5)vp.plot(sidewalk, 'k--', 'tmp')print(sidewalk)LINESTRING (54 37 0,62.0 35.5 0,70.5 38.0 0,74.5 31.5 0)
# 批量修改线要素中每个点的坐标 # 使用SetPoint指定点的索引,逐个修改 sidewalk2 = sidewalk.Clone()for i in range(sidewalk.GetPointCount()): sidewalk.SetPoint(i, sidewalk.GetX(i), sidewalk.GetY(i)+ 1)vp.plot(sidewalk, 'b--')vp.plot(sidewalk2, 'r--')print(sidewalk)LINESTRING (54 38 0,62.0 36.5 0,70.5 39.0 0,74.5 32.5 0)
# 清点要素中点的个数print(sidewalk.GetPointCount()) # vertices# 清点要素中sub-geometries(子几何对象)的个数print(sidewalk.GetGeometryCount()) # sub-geometries4
0
# 将线对象的顶点导出为列表print(sidewalk.GetPoints())[(54.0, 38.0, 0.0), (62.0, 36.5, 0.0), (70.5, 39.0, 0.0), (74.5, 32.5, 0.0)]
# 在第二和第三个顶点之间插入一个点# 注意插入的语法是[2:2]vertices = sidewalk.GetPoints()vertices[2:3] = [(66.5, 35)]print(vertices)[(54.0, 38.0, 0.0), (62.0, 36.5, 0.0), (66.5, 35), (74.5, 32.5, 0.0)]
# 从上面的列表生成新的线对象new_sidewalk = ogr.Geometry(ogr.wkbLineString)for vertex in vertices: new_sidewalk.AddPoint(*vertex)vp.plot(new_sidewalk, 'g:')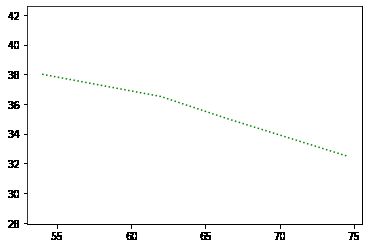
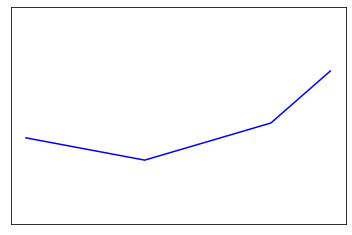
# 从geojson文件中读取线对象# 注意!!!原geojson文件语法有错误,倒数第三行最后多了个一逗号ds = ogr.Open(os.path.join(data_dir, 'misc', 'line-example.geojson'))lyr = ds.GetLayer()feature = lyr.GetFeature(0)line = feature.geometry().Clone()vp.clear()vp.plot(line, 'b-')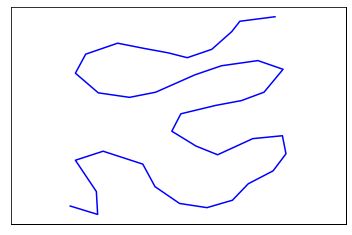
# 为线对象添加新的顶点# 使用GetPoints得到顶点列表,用列表的方式添加# 用*符号把传递的元组对象“炸开”# 从后往前添加,因为加入新顶点后,后边的顶点索引会自动更新# 如果你从前往后加,容易搞乱了到底是往哪个点后面添加新的点vertices = line.GetPoints()vertices[26:26] = [(87, 57)]vertices[19:19] = [(95, 38), (97, 43), (101, 42)]vertices[11:11] = [(121, 18)]vertices[5:5] = [(67, 32), (74, 30)]new_line = ogr.Geometry(ogr.wkbLineString)for vertex in vertices: new_line.AddPoint(*vertex)vp.plot(line, 'b-')vp.plot(new_line, 'b--')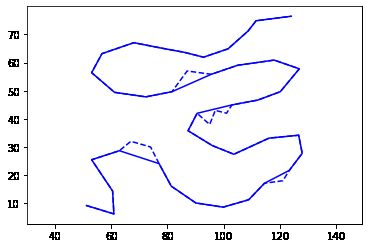
多线(wkbMultiLineString)
- 先创建多个线对象,再合并
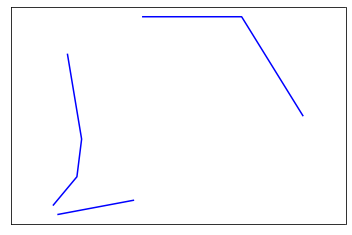
# 创建多个Line对象,然后合并为MultiLinepath1 = ogr.Geometry(ogr.wkbLineString)path1.AddPoint(61.5, 29)path1.AddPoint(63, 20)path1.AddPoint(62.5, 16)path1.AddPoint(60, 13)path2 = ogr.Geometry(ogr.wkbLineString)path2.AddPoint(60.5, 12)path2.AddPoint(68.5, 13.5)path3 = ogr.Geometry(ogr.wkbLineString)path3.AddPoint(69.5, 33)path3.AddPoint(80, 33)path3.AddPoint(86.5, 22.5)paths = ogr.Geometry(ogr.wkbMultiLineString)paths.AddGeometry(path1)paths.AddGeometry(path2)paths.AddGeometry(path3)0
# 可视化vp.clear()vp.plot(paths, 'b-')print(paths)MULTILINESTRING ((61.5 29.0 0,63 20 0,62.5 16.0 0,60 13 0),(60.5 12.0 0,68.5 13.5 0),(69.5 33.0 0,80 33 0,86.5 22.5 0))
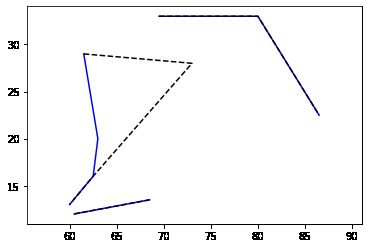
# 多线对象的编辑# 获取多线对象内部的线对象,然后逐一编辑# 例如,获取多线内部的0号对象(0号线),然后更改索引为1的点的坐标(从0开始数)paths2 = paths.Clone()paths2.GetGeometryRef(0).SetPoint(1, 73, 28)vp.plot(paths, 'b-')vp.plot(paths2, 'k--', 'tmp')print(paths)print(paths2)MULTILINESTRING ((61.5 29.0 0,63 20 0,62.5 16.0 0,60 13 0),(60.5 12.0 0,68.5 13.5 0),(69.5 33.0 0,80 33 0,86.5 22.5 0))
MULTILINESTRING ((61.5 29.0 0,73 28 0,62.5 16.0 0,60 13 0),(60.5 12.0 0,68.5 13.5 0),(69.5 33.0 0,80 33 0,86.5 22.5 0))
# 批量编辑点的坐标paths3 = paths.Clone()for i in range(paths3.GetGeometryCount()): path = paths3.GetGeometryRef(i) for j in range(path.GetPointCount()): path.SetPoint(j, path.GetX(j) + 2, path.GetY(j) - 3)vp.plot(paths, 'b-')vp.plot(paths3, 'r--')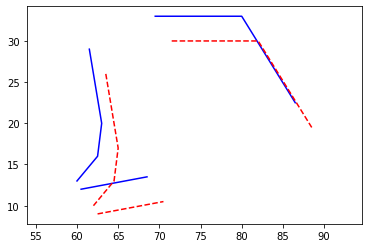
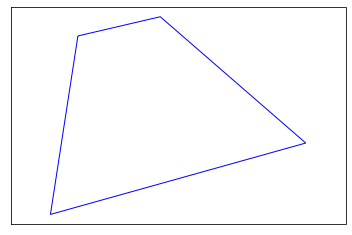
多边形
- 由首尾相接的线组成一个封闭的环
- 也可以由多个环嵌套成甜甜圈状
- 必须至少创建一个环,然后添加到多边形对象
- 最后需要CloseRings()方法令环闭合
- shapefile规定外环必须是顺时针方向,但GeoJSON没有规定。对每个数据类型需要参考相应的文档
# 首先新建一个环,添加顶点ring = ogr.Geometry(ogr.wkbLinearRing)ring.AddPoint(58, 38.5)ring.AddPoint(53, 6)ring.AddPoint(99.5, 19)ring.AddPoint(73, 42)# 新建一个多边形yard = ogr.Geometry(ogr.wkbPolygon)# 将环添加到多边形yard.AddGeometry(ring)# 将环闭合yard.CloseRings()# 可视化一下vp = VectorPlotter(False)vp.plot(yard, fill=False, edgecolor='blue')print(yard)POLYGON ((58.0 38.5 0,53 6 0,99.5 19.0 0,73 42 0,58.0 38.5 0))
# 编辑多边形对象# 要先取出环再编辑# 环不用放回去,更新了环之后争夺个多边形也更新了yard2 = yard.Clone()ring = yard2.GetGeometryRef(0)for i in range(ring.GetPointCount()): ring.SetPoint(i, ring.GetX(i) - 5, ring.GetY(i))vp.plot(yard, fill=False, edgecolor='blue')vp.plot(yard2, fill=False, ec='red', linestyle='dashed')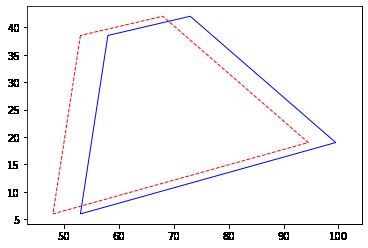
# 向多边形添加新的顶点,先取出环,再编辑yard3 = yard.Clone()ring = yard3.GetGeometryRef(0)vertices = ring.GetPoints()vertices[2:3] = ((90, 16), (90, 27))for i in range(len(vertices)): ring.SetPoint(i, *vertices[i])vp.plot(yard, fill=False, edgecolor='blue')vp.plot(yard3, fill=False, ec='black', ls='dotted', linewidth=3)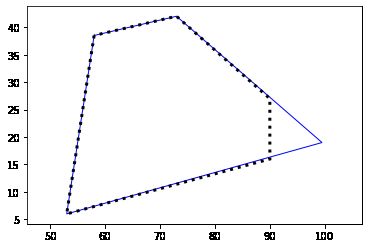
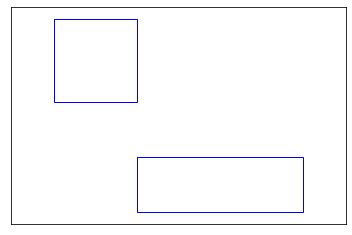
复合多边形对象multipolygons
- 一个复合多边形对象由多个多边形对象组成
- 群岛、飞地、北师大本部-沙河校区-珠海校区
# 新建复合多边形对象# 甜甜圈状的嵌套多边形# 创建两个环,先外环再内环,然后闭合# 第一个环box1 = ogr.Geometry(ogr.wkbLinearRing)box1.AddPoint(87.5, 25.5)box1.AddPoint(89, 25.5)box1.AddPoint(89, 24)box1.AddPoint(87.5, 24)garden1 = ogr.Geometry(ogr.wkbPolygon)garden1.AddGeometry(box1)# 第二个环box2 = ogr.Geometry(ogr.wkbLinearRing)box2.AddPoint(89, 23)box2.AddPoint(92, 23)box2.AddPoint(92,22)box2.AddPoint(89,22)garden2 = ogr.Geometry(ogr.wkbPolygon)garden2.AddGeometry(box2)# 闭合gardens = ogr.Geometry(ogr.wkbMultiPolygon)gardens.AddGeometry(garden1)gardens.AddGeometry(garden2)gardens.CloseRings()vp.clear()vp.plot(gardens, fill=False, ec='blue')vp.zoom(-1)print(gardens)MULTIPOLYGON (((87.5 25.5 0,89.0 25.5 0,89 24 0,87.5 24.0 0,87.5 25.5 0)),((89 23 0,92 23 0,92 22 0,89 22 0,89 23 0)))
# 编辑复合多边形,要取出多边形,再从中取出每个环,进行编辑gardens2 = gardens.Clone()for i in range(gardens2.GetGeometryCount()): ring = gardens2.GetGeometryRef(i).GetGeometryRef(0) for j in range(ring.GetPointCount()): ring.SetPoint(j, ring.GetX(j) + 1, ring.GetY(j) + 0.5)vp.plot(gardens, fill=False, ec='blue')vp.plot(gardens2, fill=False, ec='red', ls='dashed')vp.zoom(-1)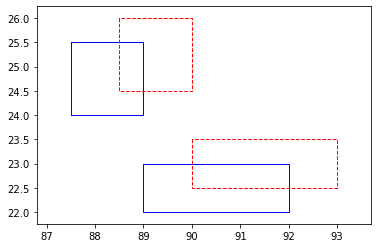
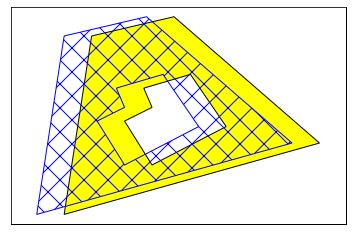
# 甜甜圈状多边形的编辑# 用for循环取出每一个环,逐个编辑# 不要假定你的多边形不是甜甜圈,这会在后期带来buglot = ogr.Geometry(ogr.wkbLinearRing)lot.AddPoint(58, 38.5)lot.AddPoint(53, 6)lot.AddPoint(99.5, 19)lot.AddPoint(73, 42)house = ogr.Geometry(ogr.wkbLinearRing)house.AddPoint(67.5, 29)house.AddPoint(69, 25.5)house.AddPoint(64, 23)house.AddPoint(69, 15)house.AddPoint(82.5, 22)house.AddPoint(76, 31.5)yard = ogr.Geometry(ogr.wkbPolygon)yard.AddGeometry(lot)yard.AddGeometry(house)yard.CloseRings()vp.clear()vp.plot(yard, 'yellow')print(yard)yard2 = yard.Clone()for i in range(yard2.GetGeometryCount()): ring = yard2.GetGeometryRef(i) for j in range(ring.GetPointCount()): ring.SetPoint(j, ring.GetX(j) - 5, ring.GetY(j))print(yard2)vp.plot(yard2, fill=False, hatch='x', color='blue')POLYGON ((58.0 38.5 0,53 6 0,99.5 19.0 0,73 42 0,58.0 38.5 0),(67.5 29.0 0,69.0 25.5 0,64 23 0,69 15 0,82.5 22.0 0,76.0 31.5 0,67.5 29.0 0))
POLYGON ((53.0 38.5 0,48 6 0,94.5 19.0 0,68 42 0,53.0 38.5 0),(62.5 29.0 0,64.0 25.5 0,59 23 0,64 15 0,77.5 22.0 0,71.0 31.5 0,62.5 29.0 0))
空间分析
- 在上述课程中,我们已经构建和展示了各种几何对象构成的要素和图层
- 空间分析是GIS系统的重要功能,代替人脑实现定量化、大规模的地理数据计算与分析
- 最常见的数据生产手段:通过空间分析创建新数据,而不是从头开始输入和编辑
- 掌握先进且方便的科研方法,数据读写与科学计算库的结合
- 进入地理数据的自由王国(想干啥就能干啥)
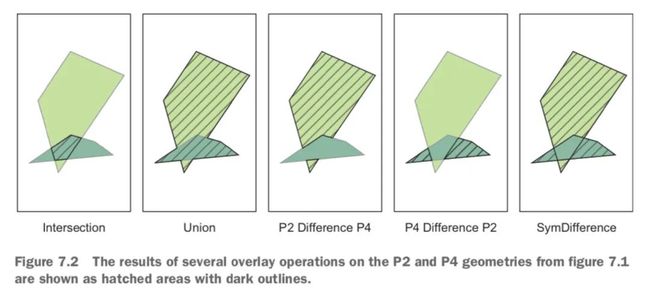
叠加分析
* 相交:Intersects
* 接触:Touches
* 穿过:Crosses
* 内部:Within
* 包含:Contains
* 重叠:Overlaps
* 不相交:Disjoint
- 下图从左至右:相交、联合、P2和P4的差集、P4和P2的差集、对称差集
新奥尔良湿地范围的叠加分析
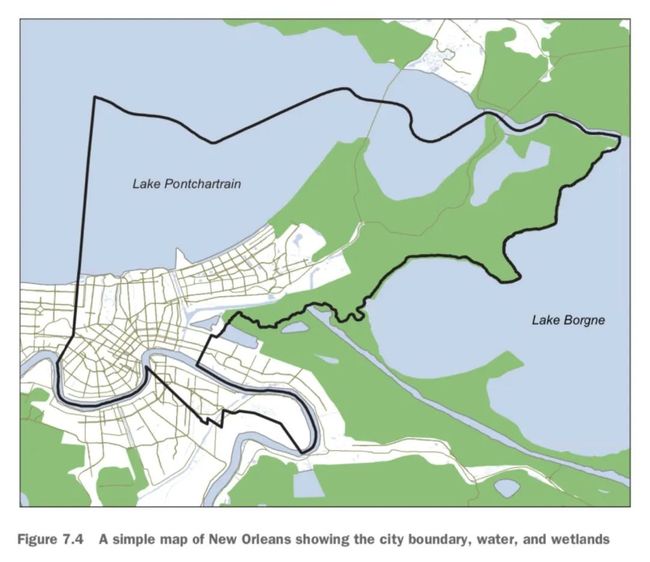
# 载入新奥尔良周边的湿地边界(已经预先裁剪好)vp = VectorPlotter(False)water_ds = ogr.Open(os.path.join(data_dir, 'US', 'wtrbdyp010.shp'))water_lyr = water_ds.GetLayer(0)water_lyr.SetAttributeFilter('WaterbdyID = 1011327')marsh_feat = water_lyr.GetNextFeature()marsh_geom = marsh_feat.geometry().Clone()vp.plot(marsh_geom, 'b')# 载入新奥尔良市行政区范围边界nola_ds = ogr.Open(os.path.join(data_dir, 'Louisiana', 'NOLA.shp'))nola_lyr = nola_ds.GetLayer(0)nola_feat = nola_lyr.GetNextFeature()nola_geom = nola_feat.geometry().Clone()vp.plot(nola_geom, fill=False, ec='red', ls='dashed', lw=3)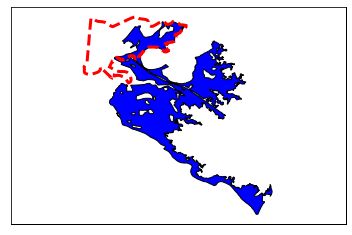
# 使用相交分析函数# 获得新奥尔良城市内的湿地范围# 注意面向对象的语法intersection = marsh_geom.Intersection(nola_geom)vp.plot(marsh_geom, 'b')vp.plot(nola_geom, fill=False, ec='red', ls='dashed', lw=3)vp.plot(intersection, 'yellow', hatch='x')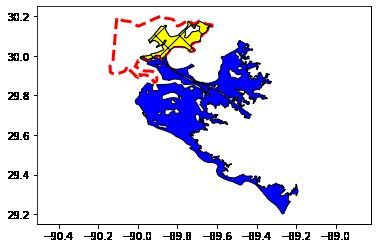
# 统计新奥尔良市行政区范围内有多少是湿地# 使用GetArea方法,通过空间过滤器实现water_lyr.SetAttributeFilter("Feature != 'Lake'")water_lyr.SetSpatialFilter(nola_geom)wetlands_area = 0for feat in water_lyr: intersect = feat.geometry().Intersection(nola_geom) wetlands_area += intersect.GetArea() print(intersect.GetArea())pcnt = wetlands_area / nola_geom.GetArea()print('{:.1%} of New Orleans is wetland'.format(pcnt))0.0006515340173894044
0.0014098862841060988
0.022241193829142178
6.680527991115466e-07
28.7% of New Orleans is wetland
# 统计新奥尔良市行政区范围内有多少是湿地# 在内存中建立临时图层,使用SQL语句实现water_lyr.SetSpatialFilter(None)water_lyr.SetAttributeFilter("Feature != 'Lake'")memory_driver = ogr.GetDriverByName('Memory')temp_ds = memory_driver.CreateDataSource('temp')temp_lyr = temp_ds.CreateLayer('temp')nola_lyr.Intersection(water_lyr, temp_lyr)sql = 'SELECT SUM(OGR_GEOM_AREA) AS area FROM temp'lyr = temp_ds.ExecuteSQL(sql)pcnt = lyr.GetFeature(0).GetField('area') / nola_geom.GetArea()print('{:.1%} of New Orleans is wetland'.format(pcnt))28.7% of New Orleans is wetland
邻近分析
- 要素之间相距多远?相互之间的最短距离是?
# 美国有多少城市在火山周边10英里(16000米)内?# 一种有缺陷的方法# 每个火山周围画出16000米的缓冲区,然后做叠加分析from osgeo import ogr# 载入数据shp_ds = ogr.Open(os.path.join(data_dir,'US'))volcano_lyr = shp_ds.GetLayer('us_volcanos_albers')cities_lyr = shp_ds.GetLayer('cities_albers')# 在内存中建立一个新的图层# Create a temporary layer in memory to store the buffers.memory_driver = ogr.GetDriverByName('memory')memory_ds = memory_driver.CreateDataSource('temp')buff_lyr = memory_ds.CreateLayer('buffer')buff_feat = ogr.Feature(buff_lyr.GetLayerDefn())# 对所有的火山循环一遍,每个火山周围建立半径为16000米的缓冲区for volcano_feat in volcano_lyr: buff_geom = volcano_feat.geometry().Buffer(16000) tmp = buff_feat.SetGeometry(buff_geom) tmp = buff_lyr.CreateFeature(buff_feat)# 建好缓冲区后,进行叠加分析,城市(点图层)和火山周边区域(多边形图层)相交的点,进行计数 result_lyr = memory_ds.CreateLayer('result')buff_lyr.Intersection(cities_lyr, result_lyr)print('Cities: {}'.format(result_lyr.GetFeatureCount()))Cities: 83
# 在上一个例子中,有的城市离多个火山的距离不超过10英里,被算了多次!# 美国有多少城市在火山周边10英里(16000米)内?# 一种更好的方法# 每个火山周围画出16000米的缓冲区# 然后合并为一个复合多边形对象,再做叠加分析import ogrshp_ds = ogr.Open(os.path.join(data_dir,'US'))volcano_lyr = shp_ds.GetLayer('us_volcanos_albers')cities_lyr = shp_ds.GetLayer('cities_albers')multipoly = ogr.Geometry(ogr.wkbMultiPolygon)for volcano_feat in volcano_lyr: buff_geom = volcano_feat.geometry().Buffer(16000) multipoly.AddGeometry(buff_geom)cities_lyr.SetSpatialFilter(multipoly.UnionCascaded())print('Cities: {}'.format(cities_lyr.GetFeatureCount()))Cities: 78
空间参考
空间参考系统(SRS,spatial reference systems)
- 知道什么地方在哪里,需要提供的基本信息
- 包括:坐标系,基准面,投影,三个部分
- 地理坐标系(Geographic Coordinate System),是使用三维球面来定义地球表面位置,以实现通过经纬度对地球表面点位引用的坐标系。一个地理坐标系包括角度测量单位、本初子午线和参考椭球体三部分
- 基准面:是指用来准确定义三维地球形状的一组参数和控制点,分为区域基准面和地心基准面
- 投影:将坐标从三维球体转换到二维地图上的方式
采集和处理数据时,必须知道完整的空间参考信息,否则采集和处理的数据可能偏差很大,甚至无法使用!
例如:
34° 01’ 43.72995’’ -117° 12’ 54.61539’’34° 01’ 43.77884’’ -117° 12’ 57.75961’’- 当更改基准面或修正基准面时,地理坐标系(数据的坐标值)将发生改变。
- 这是加利福尼亚州雷德兰兹的一个控制点基于北美洲基准面1983(NAD1983或NAD83)的度分秒(DMS)坐标:
- 该点在北美洲基准面1927(NAD1927或NAD27)中的坐标是:
- 两坐标经度值有约 3 秒的差异,而纬度值有约 0.05 秒的差异。
使用OGR空间参考
- 空间参考系统SRS,用SpatialReference对象表示
- 对于图层,用GetSpatialRef函数取到SRS
- 对于几何对象,用GetSpatial-Reference对象取到SRS
- 如果没有包含SRS信息,返回None
# 载入数据,读取SRSds = ogr.Open(os.path.join(data_dir, 'US', 'states_48.shp'))srs = ds.GetLayer().GetSpatialRef()# 打印SRS,WKT格式print(srs)GEOGCS["NAD83",
DATUM["North_American_Datum_1983",
SPHEROID["GRS 1980",6378137,298.257222101,
AUTHORITY["EPSG","7019"]],
TOWGS84[0,0,0,0,0,0,0],
AUTHORITY["EPSG","6269"]],
PRIMEM["Greenwich",0,
AUTHORITY["EPSG","8901"]],
UNIT["degree",0.0174532925199433,
AUTHORITY["EPSG","9122"]],
AUTHORITY["EPSG","4269"]]
- 上面这个例子,这不是一个投影的SRS,只有GEOGCS,没有PROJCS
- 教材中有新建SRS的详细步骤,你也可以从你的地理数据中取出一个来用
# 用不同的格式打印# PROJ.4print(srs.ExportToProj4())+proj=longlat +ellps=GRS80 +towgs84=0,0,0,0,0,0,0 +no_defs
# 创建空间参考对象from osgeo import osrutm_sr = osr.SpatialReference()utm_sr.ImportFromEPSG(26912)print(utm_sr) # WKTprint(utm_sr.ExportToProj4()) # PROJ.4PROJCS["NAD83 / UTM zone 12N",
# 打印空间参考的相关属性# Get the projection name.print(utm_sr.GetAttrValue('PROJCS'))# Get the authority.print(utm_sr.GetAttrValue('AUTHORITY'))print(utm_sr.GetAttrValue('AUTHORITY', 1))# Get the datum code.print(utm_sr.GetAuthorityCode('DATUM'))NAD83 / UTM zone 12N
EPSG
26912
6269
创建空间参考对象
- 从 http://www.spatialreference.org/ 上查到EPSG代码、WKT、PROJ.4字符串和SRS的其它表示方式
- WKT(Well Known Text)详细描述空间参考系统的文本文件格式
- EPSG(European Petroleum Survey Group)欧洲石油调查组的代码,每个代码对应一种空间参考系统
- PROJ.4是一个流行的制图投影开源库,用于在不同的投影之间转换数据
- 可用于获取空间参考系统的文本表示,请参看教材附录
# Create a UTM SRS from an EPSG code.sr = osr.SpatialReference()sr.ImportFromEPSG(26912)print(sr.GetAttrValue('PROJCS'))NAD83 / UTM zone 12N
# Create a UTM SRS from a PROJ.4 string.sr = osr.SpatialReference()sr.ImportFromProj4('''+proj=utm +zone=12 +ellps=GRS80 +towgs84=0,0,0,0,0,0,0 +units=m +no_defs ''')print(sr.GetAttrValue('PROJCS'))UTM Zone 12, Northern Hemisphere
# Create a unprojected SRS from a WKT string.wkt = '''GEOGCS["GCS_North_American_1983", DATUM["North_American_Datum_1983", SPHEROID["GRS_1980",6378137.0,298.257222101]], PRIMEM["Greenwich",0.0], UNIT["Degree",0.0174532925199433]]'''sr = osr.SpatialReference(wkt)print(sr)GEOGCS["GCS_North_American_1983",
DATUM["North_American_Datum_1983",
SPHEROID["GRS_1980",6378137.0,298.257222101]],
PRIMEM["Greenwich",0.0],
UNIT["Degree",0.0174532925199433]]
# Create an Albers SRS using parameters.sr = osr.SpatialReference()sr.SetProjCS('USGS Albers')sr.SetWellKnownGeogCS('NAD83')sr.SetACEA(29.5, 45.5, 23, -96, 0, 0)sr.Fixup()sr.Validate()print(sr)PROJCS["USGS Albers",
GEOGCS["NAD83",
    DATUM["North_American_Datum_1983",
        SPHEROID["GRS 1980",6378137,298.257222101,
            AUTHORITY["EPSG","7019"]],
        TOWGS84[0,0,0,0,0,0,0],
        AUTHORITY["EPSG","6269"]],
    PRIMEM["Greenwich",0,
        AUTHORITY["EPSG","8901"]],
    UNIT["degree",0.0174532925199433,
        AUTHORITY["EPSG","9122"]],
AUTHORITY["EPSG","4269"]],
PROJECTION["Albers_Conic_Equal_Area"],
PARAMETER["standard_parallel_1",29.5],
PARAMETER["standard_parallel_2",45.5],
PARAMETER["latitude_of_center",23],
PARAMETER["longitude_of_center",-96],
PARAMETER["false_easting",0],
PARAMETER["false_northing",0],
UNIT["Meter",1]]
# 绘制全球陆地world = pb.get_shp_geom(os.path.join(data_dir, 'global', 'ne_110m_land_1p.shp'))vp = VectorPlotter(True)vp.plot(world)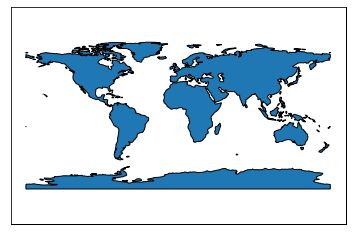
# 埃菲尔铁塔的坐标转换,设定经纬度坐标tower = ogr.Geometry(wkt='POINT (2.294694 48.858093)')tower.AssignSpatialReference(osr.SpatialReference(osr.SRS_WKT_WGS84))# 按投影坐标系,Web墨卡托投影绘制# 注意:全球和埃菲尔铁搭这两个几何对象本身都被改变了 gdal.SetConfigOption('OGR_ENABLE_PARTIAL_REPROJECTION','TRUE')web_mercator_sr = osr.SpatialReference()web_mercator_sr.ImportFromEPSG(3857)world = pb.get_shp_geom(os.path.join(data_dir, 'global','ne_110m_land_1p.shp'))world.TransformTo(web_mercator_sr)tower.TransformTo(web_mercator_sr)vp.clear()vp.plot(world)print(tower)# Web墨卡托其实不是一个正式的投影坐标系,# 是Google码农任性开脑洞的产物,所以它的代码也比较的有意思…# 测绘专家和码农们,你们先撕,我们吃瓜群众看看就好#(参考 https://blog.csdn.net/kikitamoon/article/details/46124935 )POINT (255444.16760638 6250816.95768025)

使用pyproj对坐标进行变换
- pyproj是PROJ.4的包装器,处理的是坐标值列表
- pyproj可以处理python列表、元组、numpy数组等,是处理大批坐标的好帮手
# 地理坐标转换到投影坐标import pyprojutm_proj = pyproj.Proj('+proj=utm +zone=31 +ellps=WGS84')x, y = utm_proj(2.294694, 48.858093)print(x, y)448265.9146797116 5411920.651461346
# 投影坐标转换到地理坐标# 注意将inverse选项设置为Truex1, y1 = utm_proj(x, y, inverse=True)print(x1, y1)2.294694 48.85809299999998
# 不同坐标系之间的转换:WGS84转换为NAD27wgs84 = pyproj.Proj('+proj=utm +zone=18 +datum=WGS84')nad27 = pyproj.Proj('+proj=utm +zone=18 +datum=NAD27')x, y = pyproj.transform(wgs84, nad27, 580744.32, 4504695.26)print(x, y)580712.7534284436 4504476.041497709
今天的分享的关于利用python处理矢量数据就到这里啦!内容有些多,希望对大家有帮助。文中所用示例数据,大家点击下方阅读原文即可获取(提取码:aazv)。欢迎大家扫码关注!