NBA球员数据分析
- 1.导入库
- 2.获取数据
- 3.数据分析
-
- 3.1 数据相关性--heatmap()
- 3.2 球员数据分析
- 3.3 seaborn常用的三个可视化方法
-
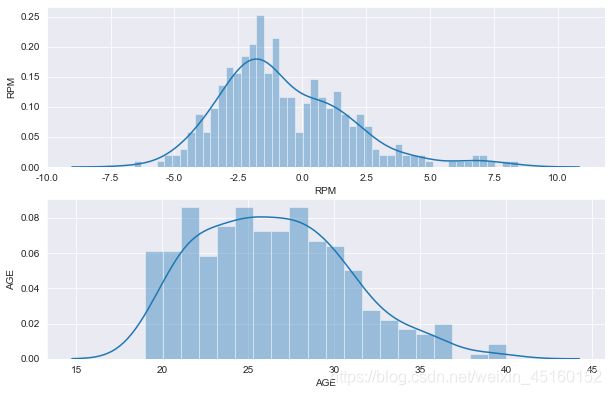
- 3.3.1 单变量--distplot()
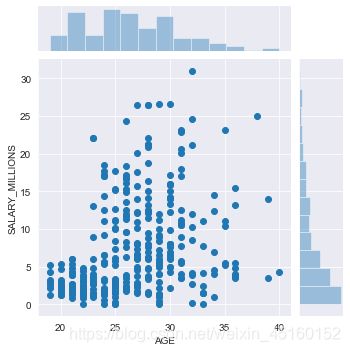
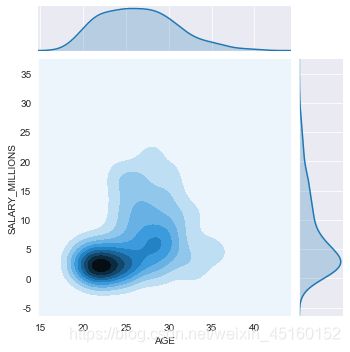
- 3.3.2 双变量--jointplot()
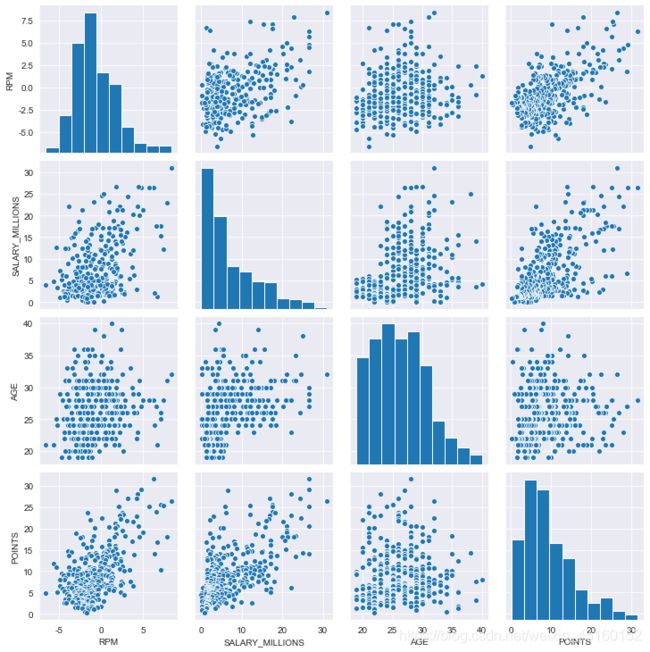
- 3.3.3 多变量--pairplot()
- 3.4 多变量衍生
- 4.资料网盘
1.导入库
import numpy as np
import pandas as pd
import matplotlib.pyplot as plt
import seaborn as sns
import cv2
from pylab import mpl
mpl.rcParams["font.sans-serif"] = ["SimHei"]
mpl.rcParams["axes.unicode_minus"] = False
2.获取数据
data = pd.read_csv('./2.code/data/nba_2017_nba_players_with_salary.csv')
data.head(10)
img = cv2.imread('6.seabron_alignment.png',1)
cv2.imshow('imge',img,)
cv2.waitKey(0)
data.shape
(342, 38)
data.describe()
|
Rk |
AGE |
MP |
FG |
FGA |
FG% |
3P |
3PA |
3P% |
2P |
... |
GP |
MPG |
ORPM |
DRPM |
RPM |
WINS_RPM |
PIE |
PACE |
W |
SALARY_MILLIONS |
| count |
342.000000 |
342.000000 |
342.000000 |
342.000000 |
342.000000 |
342.000000 |
342.000000 |
342.000000 |
320.000000 |
342.000000 |
... |
342.000000 |
342.000000 |
342.000000 |
342.000000 |
342.000000 |
342.000000 |
342.000000 |
342.000000 |
342.000000 |
342.000000 |
| mean |
217.269006 |
26.444444 |
21.572515 |
3.483626 |
7.725439 |
0.446096 |
0.865789 |
2.440058 |
0.307016 |
2.620175 |
... |
58.198830 |
21.572807 |
-0.676023 |
-0.005789 |
-0.681813 |
2.861725 |
9.186842 |
98.341053 |
28.950292 |
7.294006 |
| std |
136.403138 |
4.295686 |
8.804018 |
2.200872 |
4.646933 |
0.078992 |
0.780010 |
2.021716 |
0.134691 |
1.828714 |
... |
22.282015 |
8.804121 |
2.063237 |
1.614293 |
2.522014 |
3.880914 |
3.585475 |
2.870091 |
14.603876 |
6.516326 |
| min |
1.000000 |
19.000000 |
2.200000 |
0.000000 |
0.800000 |
0.000000 |
0.000000 |
0.000000 |
0.000000 |
0.000000 |
... |
2.000000 |
2.200000 |
-4.430000 |
-3.920000 |
-6.600000 |
-2.320000 |
-1.600000 |
87.460000 |
0.000000 |
0.030000 |
| 25% |
100.250000 |
23.000000 |
15.025000 |
1.800000 |
4.225000 |
0.402250 |
0.200000 |
0.800000 |
0.280250 |
1.200000 |
... |
43.500000 |
15.025000 |
-2.147500 |
-1.222500 |
-2.422500 |
0.102500 |
7.100000 |
96.850000 |
19.000000 |
2.185000 |
| 50% |
205.500000 |
26.000000 |
21.650000 |
3.000000 |
6.700000 |
0.442000 |
0.700000 |
2.200000 |
0.340500 |
2.200000 |
... |
66.000000 |
21.650000 |
-0.990000 |
-0.130000 |
-1.170000 |
1.410000 |
8.700000 |
98.205000 |
29.000000 |
4.920000 |
| 75% |
327.750000 |
29.000000 |
29.075000 |
4.700000 |
10.400000 |
0.481000 |
1.400000 |
3.600000 |
0.373500 |
3.700000 |
... |
76.000000 |
29.075000 |
0.257500 |
1.067500 |
0.865000 |
4.487500 |
10.900000 |
100.060000 |
39.000000 |
11.110000 |
| max |
482.000000 |
40.000000 |
37.800000 |
10.300000 |
24.000000 |
0.750000 |
4.100000 |
10.000000 |
1.000000 |
9.700000 |
... |
82.000000 |
37.800000 |
7.270000 |
6.020000 |
8.420000 |
20.430000 |
23.000000 |
109.870000 |
66.000000 |
30.960000 |
8 rows × 35 columns
3.数据分析
3.1 数据相关性–heatmap()
data_cor = data.loc[:, ['RPM', 'AGE', 'SALARY_MILLIONS', 'ORB', 'DRB', 'TRB','AST', 'STL', 'BLK', 'TOV', 'PF', 'POINTS', 'GP', 'MPG', 'ORPM', 'DRPM']]
data_cor.head()
|
RPM |
AGE |
SALARY_MILLIONS |
ORB |
DRB |
TRB |
AST |
STL |
BLK |
TOV |
PF |
POINTS |
GP |
MPG |
ORPM |
DRPM |
| 0 |
6.27 |
28 |
26.50 |
1.7 |
9.0 |
10.7 |
10.4 |
1.6 |
0.4 |
5.4 |
2.3 |
31.6 |
81 |
34.6 |
6.74 |
-0.47 |
| 1 |
4.81 |
27 |
26.50 |
1.2 |
7.0 |
8.1 |
11.2 |
1.5 |
0.5 |
5.7 |
2.7 |
29.1 |
81 |
36.4 |
6.38 |
-1.57 |
| 2 |
1.83 |
27 |
6.59 |
0.6 |
2.1 |
2.7 |
5.9 |
0.9 |
0.2 |
2.8 |
2.2 |
28.9 |
76 |
33.8 |
5.72 |
-3.89 |
| 3 |
4.35 |
23 |
22.12 |
2.3 |
9.5 |
11.8 |
2.1 |
1.3 |
2.2 |
2.4 |
2.2 |
28.0 |
75 |
36.1 |
0.45 |
3.90 |
| 4 |
4.20 |
26 |
16.96 |
2.1 |
8.9 |
11.0 |
4.6 |
1.4 |
1.3 |
3.7 |
3.9 |
27.0 |
72 |
34.2 |
3.56 |
0.64 |
corr = data_cor.corr()
corr.head()
|
RPM |
AGE |
SALARY_MILLIONS |
ORB |
DRB |
TRB |
AST |
STL |
BLK |
TOV |
PF |
POINTS |
GP |
MPG |
ORPM |
DRPM |
| RPM |
1.000000 |
0.175820 |
0.477542 |
0.388764 |
0.623515 |
0.587853 |
0.481971 |
0.599008 |
0.463097 |
0.492014 |
0.434226 |
0.604432 |
0.340810 |
0.549449 |
0.769822 |
0.578388 |
| AGE |
0.175820 |
1.000000 |
0.353312 |
-0.015752 |
0.088859 |
0.062064 |
0.114908 |
0.069892 |
-0.062917 |
0.030673 |
0.005512 |
0.031422 |
0.051863 |
0.099657 |
0.136177 |
0.100636 |
| SALARY_MILLIONS |
0.477542 |
0.353312 |
1.000000 |
0.264954 |
0.531569 |
0.482088 |
0.486159 |
0.446763 |
0.260288 |
0.536993 |
0.341512 |
0.635425 |
0.348093 |
0.594162 |
0.503682 |
0.102307 |
| ORB |
0.388764 |
-0.015752 |
0.264954 |
1.000000 |
0.731345 |
0.861103 |
-0.011632 |
0.169075 |
0.654265 |
0.274670 |
0.557957 |
0.284908 |
0.296975 |
0.342140 |
0.102113 |
0.476857 |
| DRB |
0.623515 |
0.088859 |
0.531569 |
0.731345 |
1.000000 |
0.976244 |
0.350786 |
0.485726 |
0.660733 |
0.598043 |
0.670708 |
0.648267 |
0.473376 |
0.684662 |
0.428433 |
0.426536 |
plt.figure(figsize=(20,8),dpi=100)
sns.heatmap(corr,square=True,linewidths=0.1,annot=True)

3.2 球员数据分析
data.loc[:, ["PLAYER", "RPM","SALARY_MILLIONS", "AGE","MPG"]].sort_values(by="RPM", ascending=False).head()
|
PLAYER |
RPM |
SALARY_MILLIONS |
AGE |
MPG |
| 6 |
LeBron James |
8.42 |
30.96 |
32 |
37.8 |
| 37 |
Chris Paul |
7.92 |
22.87 |
31 |
31.5 |
| 8 |
Stephen Curry |
7.41 |
12.11 |
28 |
33.4 |
| 120 |
Draymond Green |
7.14 |
15.33 |
26 |
32.5 |
| 7 |
Kawhi Leonard |
7.08 |
17.64 |
25 |
33.4 |
data.loc[:, ["PLAYER", "RPM","SALARY_MILLIONS", "AGE","MPG"]].sort_values(by="MPG", ascending=False).head()
|
PLAYER |
RPM |
SALARY_MILLIONS |
AGE |
MPG |
| 6 |
LeBron James |
8.42 |
30.96 |
32 |
37.8 |
| 32 |
Zach LaVine |
-2.97 |
2.24 |
21 |
37.2 |
| 14 |
Andrew Wiggins |
-1.60 |
6.01 |
21 |
37.2 |
| 11 |
Karl-Anthony Towns |
2.13 |
5.96 |
21 |
37.0 |
| 12 |
Jimmy Butler |
6.62 |
17.55 |
27 |
37.0 |
3.3 seaborn常用的三个可视化方法
3.3.1 单变量–distplot()
sns.set_style("darkgrid")
plt.figure(figsize=(10, 10))
sns.distplot(data["SALARY_MILLIONS"],hist=True, kde=True,bins=50)
plt.ylabel("salary")
plt.subplot(3, 1, 2)
sns.distplot(data["RPM"],hist=True, kde=True,bins=50)
plt.ylabel("RPM")
plt.subplot(3, 1, 3)
sns.distplot(data["AGE"],hist=True, kde=True,bins=20)
plt.ylabel("AGE")
Text(0, 0.5, 'AGE')
3.3.2 双变量–jointplot()
sns.jointplot(data.AGE, data.SALARY_MILLIONS, height=5)
sns.jointplot(data.AGE, data.SALARY_MILLIONS, kind="hex",height=5)
sns.jointplot(data.AGE, data.SALARY_MILLIONS, kind="kde",height=5)

3.3.3 多变量–pairplot()
data = data.loc[:, ['RPM','SALARY_MILLIONS','AGE','POINTS']]
sns.pairplot(data)
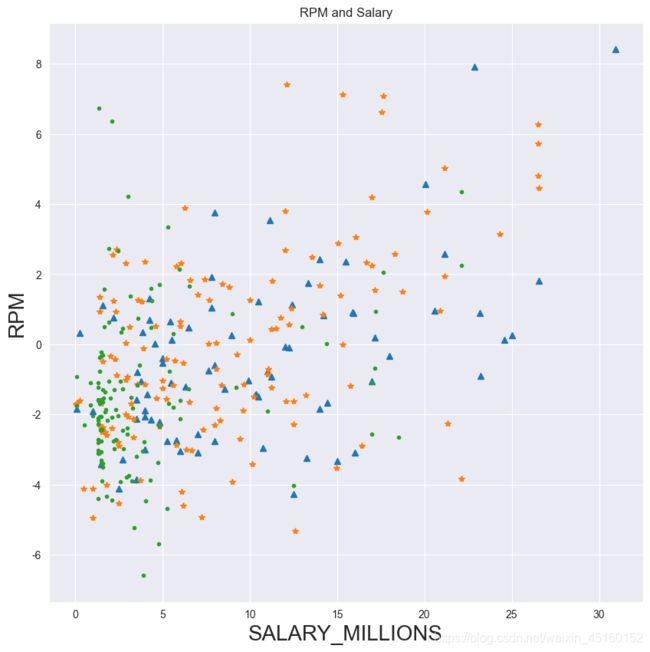
3.4 多变量衍生
def age_cut(df):
'年龄划分'
if df.AGE <= 24:
return 'young'
elif df.AGE >=30:
return 'old'
else:
return 'best'
data['age_cut']=data.apply(lambda x:age_cut(x),axis=1)
data['cut'] = 1
sns.set_style("darkgrid")
plt.figure(figsize=(10,10), dpi=100)
plt.title("RPM and Salary")
x1 = data.loc[data.age_cut == "old"].SALARY_MILLIONS
y1 = data.loc[data.age_cut == "old"].RPM
plt.plot(x1, y1,"^")
x2 = data.loc[data.age_cut == "best"].SALARY_MILLIONS
y2 = data.loc[data.age_cut == "best"].RPM
plt.plot(x2, y2,"*")
x3 = data.loc[data.age_cut == "young"].SALARY_MILLIONS
y3 = data.loc[data.age_cut == "young"].RPM
plt.plot(x3, y3,".")
plt.xlabel("SALARY_MILLIONS",fontsize = 20)
plt.ylabel("RPM",fontsize = 20)
Text(0, 0.5, 'RPM')
4.资料网盘
百度云盘:https://pan.baidu.com/s/1puAwMn8QFGiUcrmQtnoiPw ;
提取码:echo


