注意力的可视化
文章目录
- 1. 注意力热力图
- 2. 平均汇聚
1. 注意力热力图
mport torch
from d2l import torch as d2l
import matplotlib.pyplot as plt


def show_heatmaps(matrics, xlabel, ylabel, titles=None, figsize=(2.5, 2.5),
				  cmap="Reds"):
	"""

	:param matrics: 输入的矩阵值;例matrics.shape=(1,1,10,10)
	:param xlabel: 设置x轴的标签
	:param ylabel: 设置y轴的标签
	:param titles: 设置表头
	:param figsize: 设置图片的大小
	:param cmap: 设置热力图的颜色
	:return:
	"""
	# 设置图片的显示格式为'svg'
	d2l.use_svg_display()
	# 根据输入矩阵获取行数和列数
	num_rows, num_cols = matrics.shape[0], matrics.shape[1]
	# 设置画布fig和画布区域axes
	fig, axes = d2l.plt.subplots(num_rows, num_cols, figsize=figsize,
								 sharex=True, sharey=True, squeeze=False)
	# 得到axes,和数据matrix
	for i, (row_axes, row_matrix) in enumerate(zip(axes, matrics)):
		for j, (ax, matrix) in enumerate(zip(row_axes, row_matrix)):
			# 将matrix的值传入到坐标系中
			pcm = ax.imshow(matrix.detach().numpy(), cmap=cmap)
			# 设置x轴的标签
			if i == num_rows - 1:
				ax.set_xlabel(xlabel)
			# 设置y轴的标签
			if j == 0:
				ax.set_ylabel(ylabel)
			# 设置表格的抬头
			if titles:
				ax.set_title(titles[j])
	# 给画布添加新的渐变跳
	fig.colorbar(pcm, ax=axes, shrink=0.6)

# 设置注意力权重值,torch.eye表示的对角线值为1,其他位置值为0
attention_weights = torch.eye(10).reshape((1, 1, 10, 10))
show_heatmaps(attention_weights, xlabel="keys", ylabel="queries", titles=['fuckyou'])
plt.show()
2. 平均汇聚
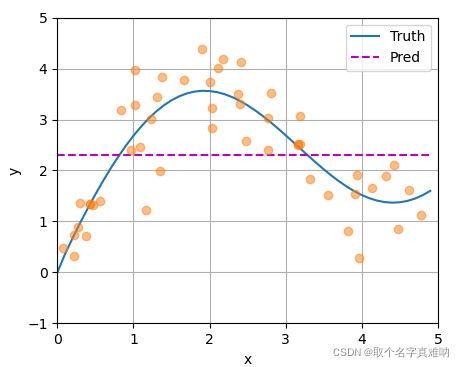
平均汇聚就是求得训练值的均值
f ( x ) = 1 n ∑ i = 1 n y i f(x)=\frac{1}{n}\sum_{i=1}^{n}y_i f(x)=n1i=1∑nyi
# 1.导入相关数据库
import torch
from d2l import torch as d2l
import matplotlib.pyplot as plt

# 2.随机生成数据,随机生成数值并排序
n_train = 50
x_train, _ = torch.sort(torch.rand(n_train) * 5)


# 3.定义函数
def f(x):
	return 2 * torch.sin(x) + x ** 0.8


# 4.生成x轴值
x_test = torch.arange(0, 5, 0.1)

# 5.生成y_train,y_truth
y_train = f(x_train) + torch.normal(0, 0.5, (n_train,))
y_truth = f(x_test)


# 6.画图
def plot_kernel_reg(y_hat):
	# 画曲线图
	d2l.plot(x_test, [y_truth, y_hat], xlabel='x', ylabel='y', legend=['truth', 'preds'],
			 xlim=[0, 5], ylim=[-1, 5])
	# 画点图
	plt.plot(x_train, y_train, 'o', alpha=0.5)

# 7.求得均值,并复制相关值
y_hat = torch.repeat_interleave(y_train.mean(), n_train)
plot_kernel_reg(y_hat)
plt.show()

