ASP.NET Chart Controls in SharePoint 2010
sharepoint2010自带的图表webpart已经够不错了。功能强大,图表漂亮。支持的数据源也多。但是有个时候确实满足不要了特定的要求,比如跨网站集访问数据源。虽说有Excel Services,但是死活配置不成功,于是乎想利用Asp.net for chart(.NET3.5版本)控件自己定义一个。
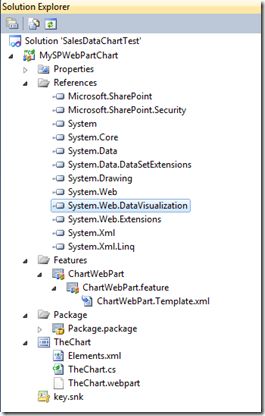
1、首先需要引用System.Web.DataVisualization.dll
2、开发,此过程省略。
3、发布到sharepoint2010注意事项
需要配置站点下的web.config,配置如下
1. The web.config entry for <httpHandlers> is:
<httpHandlers>
<add path="ChartImg.axd" verb="GET,HEAD,POST" type="System.Web.UI.DataVisualization.Charting.ChartHttpHandler, System.Web.DataVisualization, Version=3.5.0.0, Culture=neutral, PublicKeyToken=31bf3856ad364e35"
validate="false" />
</httpHandlers>
1. The web.config entry for <handlers> is:
<add name="ChartImageHandler" preCondition="integratedMode" verb="GET,HEAD,POST"
path="ChartImg.axd" type="System.Web.UI.DataVisualization.Charting.ChartHttpHandler, System.Web.DataVisualization, Version=3.5.0.0, Culture=neutral, PublicKeyToken=31bf3856ad364e35" />
3. The web.config entry for <appSettings> is as follows (make sure that the folder mentioned is present and the web site's account can write to it):
<add key="ChartImageHandler" value="storage=file;timeout=20;dir=c:\Temp\;" />
