YOLOV7学习记录之mAP计算
如何评估一个训练好模型的好坏,是目标检测中一个很重要的因素,如常见的TP、FP、AP、PR、map等
视频可以参考:
https://www.bilibili.com/video/BV1ez4y1X7g2/?spm_id_from=333.337.search-card.all.click&vd_source=0afe6d9b487e848c06b62da15f2e659f
TP、FP、TN、FN
TP:被正确分类为正样本的数量;实际是正样本,也被模型分类为正样本
FP:被错误分类为正样本的数量;实际是负样本,但被模型分类为正样本
TN:被正确分类为负样本的数量;实际是负样本,也被模型分类为负样本
FN:被错误分类为负样本的数量;实际是正样本,但被模型分类为负样本
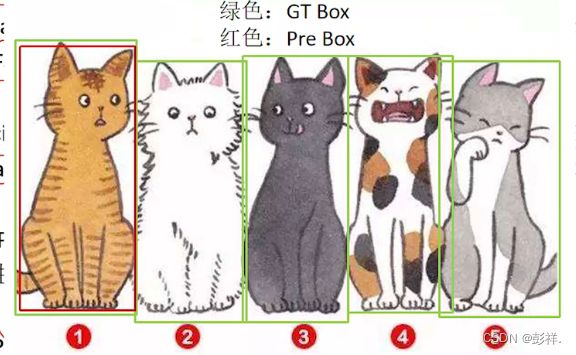
如下图举例:

红色是预测框,绿色是真实框。
假设阈值为0.5,意思就是预测框与真实框的IoU大于等于0.5时认为检测到目标了。
TP是IoU>0.5的检测框数量(在同一真实框下只计算一次),图中的框①。
FP是IoU<=0.5的检测框数量,图中的框②。
FN是没有被检测到的框数量,图中的框③。
Precision和Recall
Precision
计算公式:
P = TP / (TP + FP)
Precision是针对预测结果而言的,含义是在预测结果中,有多少预测框预测正确了。
但是光靠一个Precision指标是有缺陷的,比如在下面这种情况中:
在预测结果中,预测正确的目标有一个,预测错误的目标有0个,所以TP=1,FP=0,则P=1,但是图中除了①,②③④⑤都没有检测出来,所以单靠一个Precision指标肯定是不行的。
Recall
计算公式:
R = TP / (TP + FN)
Recall是针对原样本而言的,含义是在所有真实目标中,模型预测正确目标的比例。
但是单靠Recall来判断模型预测结果好坏也不行,比如下面这种情况:此时TP为所以检测框,而FN=0,因为没有漏检,五只猫全部找到了,虽然找了很多

AP(P-R曲线下的面积)
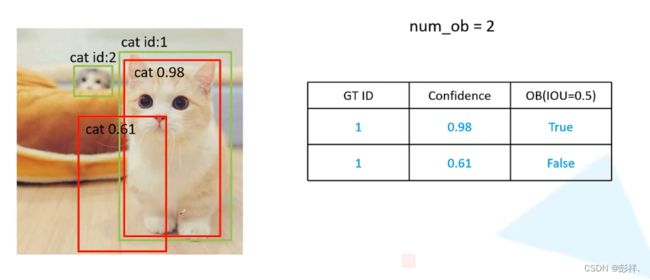
对于以下三张猫的图片,分别对每张图片进行统计,并存入一个表格中,这个表格是按照置信度降序排序的(只放入预测框):
此时真实框有两个,所有num_ob=2(num_ob是累加起来的),当IoU大于等于0.5时,认为检测到了目标。
此时num_ob=3,这张图片只有一个真实框,所以num_ob+=1

此时num_ob=7,这张图片有4个真实框,所以num_ob+=4

最后得到左边的一张表格,使用不同阈值(confidence)来判断是否匹配,此时我们使用confidence=0.98作为阈值来计算Precison和ReCall,最后我们依次调整confidence阈值,直至将其全部计算完毕。

最终结果,FP为被错误分为正样本数码,有两个False,即为2,TP为分类正确的数目(实际为正样本,被分为正样本),为5,FN为被错误分类为负样本数码(实际为正样本,被分为负样本),为7-5=2,最终我们将其全部计算完。

此时我们会得到右边的一张表格,按照这个表格,我们就可以绘制P-R曲线了,以ReCall为横坐标,Precision为纵坐标绘制,在绘制前需要删除一些Recall重复的数据,如图中的第五和第六个数据。我们保留Precision最大的即可。

注意,以上的预测框都是在经过非极大值抑制后的预测框。
mAP(mean Average Precision)
mAP是各类别AP的平均值,上面的0.6694就是猫所对应的AP值,采用这个方法,我们可以计算出所有类别所对应的AP值,再除以类别的个数,就得到了map。

执行流程
我们来梳理一下程序运行流程:
首先运行get_map.py,map计算应该在predict后完成的(predict主要是在图像中绘制出预测框),但这里分开了,也就需要我们要重新加载模型并预测输出然后在计算结果。
在get_map.py中其与predict一样初始化参数。随后
生成模型: yolo = YOLO(confidence = confidence, nms_iou = nms_iou)
获取预测结果:这里使用的是get_map_tx函数来获取预测类别,置信度,xy,w,h信息
执行预测
get_map_txt函数如下所示:
 def get_map_txt(self, image_id, image, class_names, map_out_path):
        f = open(os.path.join(map_out_path, "detection-results/"+image_id+".txt"), "w", encoding='utf-8')
        image_shape = np.array(np.shape(image)[0:2])
        #---------------------------------------------------------#
        #   在这里将图像转换成RGB图像,防止灰度图在预测时报错。
        #   代码仅仅支持RGB图像的预测,所有其它类型的图像都会转化成RGB
        #---------------------------------------------------------#
        image       = cvtColor(image)
        #---------------------------------------------------------#
        #   给图像增加灰条,实现不失真的resize
        #   也可以直接resize进行识别
        #---------------------------------------------------------#
        image_data  = resize_image(image, (self.input_shape[1], self.input_shape[0]), self.letterbox_image)
        #---------------------------------------------------------#
        #   添加上batch_size维度
        #---------------------------------------------------------#
        image_data  = np.expand_dims(np.transpose(preprocess_input(np.array(image_data, dtype='float32')), (2, 0, 1)), 0)

        with torch.no_grad():
            images = torch.from_numpy(image_data)
            if self.cuda:
                images = images.cuda()
            #---------------------------------------------------------#
            #   将图像输入网络当中进行预测!
            #---------------------------------------------------------#
            outputs = self.net(images)
            outputs = self.bbox_util.decode_box(outputs)
            #---------------------------------------------------------#
            #   将预测框进行堆叠,然后进行非极大抑制
            #---------------------------------------------------------#
            results = self.bbox_util.non_max_suppression(torch.cat(outputs, 1), self.num_classes, self.input_shape,
                        image_shape, self.letterbox_image, conf_thres = self.confidence, nms_thres = self.nms_iou)

            if results[0] is None:
                return

            top_label   = np.array(results[0][:, 6], dtype = 'int32')
            top_conf    = results[0][:, 4] * results[0][:, 5]
            top_boxes   = results[0][:, :4]

        for i, c in list(enumerate(top_label)):
            predicted_class = self.class_names[int(c)]
            box             = top_boxes[i]
            score           = str(top_conf[i])

            top, left, bottom, right = box
            if predicted_class not in class_names:
                continue

            f.write("%s %s %s %s %s %s\n" % (predicted_class, score[:6], str(int(left)), str(int(top)), str(int(right)),str(int(bottom))))

        f.close()
        return
在get_map_txt函数中,依次进行图像灰度转换,图像非失真调整,将图像输入模型,将预测输出结果进行解码,将解码结果进行非极大值抑制,到此与与预测完全相同,随后将结果进行解析,将原本的应该在图像中绘制出预测框转换成txt文本形式输出,结果如下:
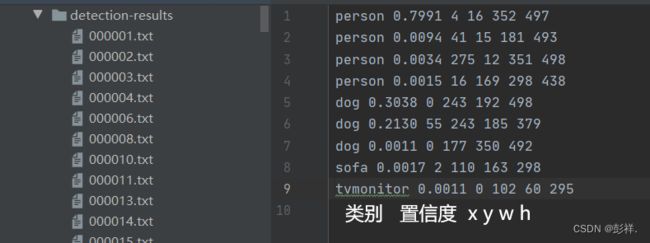
这里就对应类似

真实值xml2txt
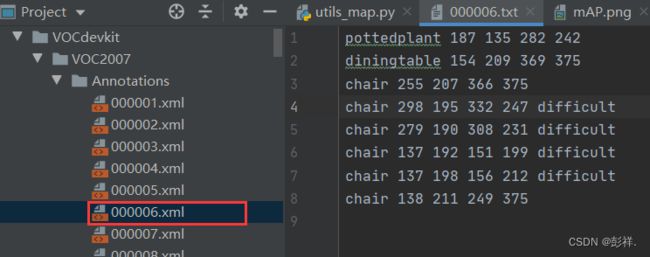
完成数据写入后,即获得了预测结果,再次回到get_map.py文件中继续执行:读取ground_truth,由于项目中使用的是VOC数据集,其标准格式为xml文件,这里需要进行转换为txt格式。
print("Get ground truth result.")
        for image_id in tqdm(image_ids):
            with open(os.path.join(map_out_path, "ground-truth/"+image_id+".txt"), "w") as new_f:
                root = ET.parse(os.path.join(VOCdevkit_path, "VOC2007/Annotations/"+image_id+".xml")).getroot()
                for obj in root.findall('object'):
                    difficult_flag = False
                    if obj.find('difficult')!=None:
                        difficult = obj.find('difficult').text
                        if int(difficult)==1:
                            difficult_flag = True
                    obj_name = obj.find('name').text
                    if obj_name not in class_names:
                        continue
                    bndbox  = obj.find('bndbox')
                    left    = bndbox.find('xmin').text
                    top     = bndbox.find('ymin').text
                    right   = bndbox.find('xmax').text
                    bottom  = bndbox.find('ymax').text

                    if difficult_flag:
                        new_f.write("%s %s %s %s %s difficult\n" % (obj_name, left, top, right, bottom))
                    else:
                        new_f.write("%s %s %s %s %s\n" % (obj_name, left, top, right, bottom))
        print("Get ground truth result done.")
在之前的学习中介绍使用的数据集是VOC但并未对其做太多介绍,这里对其标注内容简单介绍。
标注文件介绍:
<annotation>
    <folder>VOC2007folder>

    <filename>000005.jpgfilename>.

    <source>

        <database>The VOC2007 Databasedatabase>
        <annotation>PASCAL VOC2007annotation>

        <image>flickrimage>
        <flickrid>325991873flickrid>
    source>

    <owner>
        <flickrid>archintent louisvilleflickrid>
        <name>?name>
    owner>

    <size>
        <width>500width>
        <height>375height>
        <depth>3depth>
    size>

    <segmented>0segmented>

    <object>

        <name>chairname>
        <pose>Rearpose>

        <truncated>0truncated>

        <difficult>0difficult>

        <bndbox>
            <xmin>263xmin>
            <ymin>211ymin>
            <xmax>324xmax>
            <ymax>339ymax>
        bndbox>
    object>
annotation>
在我们的代码中获取object信息:

获得结果:

生成的 txt 文件与 xml 标注文件是一一对应的,其中有些会由于难以识别而后面加上 difficult
计算mAP
得到了真实值与预测值后我们就可以计算mAP了,按照前面原理中所介绍的,执行get_map函数,其实现位于util_map.py中,我们看一下其具体实现:
get_map(MINOVERLAP, draw_plot, score_threhold=0.5, path = './map_out')
参数介绍
MINOVERLAP = 0.5 ,当某一预测框与真实框重合度大于MINOVERLAP时,该预测框被认为是正样本,否则为负样本。
draw_plot=TRUE, 是否画图 score_threhold=0.5
Recall和Precision代表的是当门限值为0.5
path = ‘./map_out’ ,路径
执行get_map函数
前面是进行一些文件目录生成,如AP,F1等,接下来便是进行计算了,其计算过程代码实现还是蛮复杂的,但只要理解了前面所说的计算流程好懂了。我们来看一下其实现流程:
读取参数,设置文件目录信息
 GT_PATH             = os.path.join(path, 'ground-truth')
    DR_PATH             = os.path.join(path, 'detection-results')
    IMG_PATH            = os.path.join(path, 'images-optional')
    TEMP_FILES_PATH     = os.path.join(path, '.temp_files')
    RESULTS_FILES_PATH  = os.path.join(path, 'results')

    show_animation = True
    if os.path.exists(IMG_PATH):
        for dirpath, dirnames, files in os.walk(IMG_PATH):
            if not files:
                show_animation = False
    else:
        show_animation = False

    if not os.path.exists(TEMP_FILES_PATH):
        os.makedirs(TEMP_FILES_PATH)

    if os.path.exists(RESULTS_FILES_PATH):
        shutil.rmtree(RESULTS_FILES_PATH)
    else:
        os.makedirs(RESULTS_FILES_PATH)
    if draw_plot:
        try:
            matplotlib.use('TkAgg')
        except:
            pass
        os.makedirs(os.path.join(RESULTS_FILES_PATH, "AP"))
        os.makedirs(os.path.join(RESULTS_FILES_PATH, "F1"))
        os.makedirs(os.path.join(RESULTS_FILES_PATH, "Recall"))
        os.makedirs(os.path.join(RESULTS_FILES_PATH, "Precision"))
    if show_animation:
        os.makedirs(os.path.join(RESULTS_FILES_PATH, "images", "detections_one_by_one"))
读取ground_truth内容
for txt_file in ground_truth_files_list:#遍历ground_truth
    file_id     = txt_file.split(".txt", 1)[0]
    file_id     = os.path.basename(os.path.normpath(file_id))
    temp_path   = os.path.join(DR_PATH, (file_id + ".txt"))
    if not os.path.exists(temp_path):
        error_msg = "Error. File not found: {}\n".format(temp_path)
        error(error_msg)
    lines_list      = file_lines_to_list(txt_file)#每行读取
    bounding_boxes  = []
    is_difficult    = False
    already_seen_classes = []
    for line in lines_list:
        try:
            if "difficult" in line:
                class_name, left, top, right, bottom, _difficult = line.split()
                is_difficult = True
            else:
                class_name, left, top, right, bottom = line.split()
        except:
            if "difficult" in line:
                line_split  = line.split()
                _difficult  = line_split[-1]
                bottom      = line_split[-2]
                right       = line_split[-3]
                top         = line_split[-4]
                left        = line_split[-5]
                class_name  = ""
                for name in line_split[:-5]:
                    class_name += name + " "
                class_name  = class_name[:-1]
                is_difficult = True
            else:
                line_split  = line.split()
                bottom      = line_split[-1]
                right       = line_split[-2]
                top         = line_split[-3]
                left        = line_split[-4]
                class_name  = ""
                for name in line_split[:-4]:
                    class_name += name + " "
                class_name = class_name[:-1]

        bbox = left + " " + top + " " + right + " " + bottom
        if is_difficult:
            bounding_boxes.append({"class_name":class_name, "bbox":bbox, "used":False, "difficult":True})
            is_difficult = False
        else:
            bounding_boxes.append({"class_name":class_name, "bbox":bbox, "used":False})
            if class_name in gt_counter_per_class:
                gt_counter_per_class[class_name] += 1
            else:
                gt_counter_per_class[class_name] = 1

            if class_name not in already_seen_classes:
                if class_name in counter_images_per_class:
                    counter_images_per_class[class_name] += 1
                else:
                    counter_images_per_class[class_name] = 1
                already_seen_classes.append(class_name)

    with open(TEMP_FILES_PATH + "/" + file_id + "_ground_truth.json", 'w') as outfile:
        json.dump(bounding_boxes, outfile)

gt_classes  = list(gt_counter_per_class.keys())
gt_classes  = sorted(gt_classes)
n_classes   = len(gt_classes)
读取预测结果内容
这里我们梳理一下其运行流程:
最外层循环:for class_index, class_name in enumerate(gt_classes)
按照分类类别进行循环
第二层循环:for idx, detection in enumerate(dr_data)
按照预测文件名称进行循环,如1.txt,2.txt
第三层循环: for obj in ground_truth_data
从真实标注文件中依次获得标注框并与预测框进行iou比对,保留iou值最大的(这里计算时为该图片内某个类别)
完成第三层循环后,判断是否变为TP,否则为FP
紧接着完成第二层循环,然后进行总结TP,FP,计算Precision和ReCall
  cumsum = 0
            for idx, val in enumerate(fp):
                fp[idx] += cumsum
                cumsum += val

            cumsum = 0
            for idx, val in enumerate(tp):
                tp[idx] += cumsum
                cumsum += val

            rec = tp[:]
            for idx, val in enumerate(tp):
                rec[idx] = float(tp[idx]) / np.maximum(gt_counter_per_class[class_name], 1)

            prec = tp[:]
            for idx, val in enumerate(tp):
                prec[idx] = float(tp[idx]) / np.maximum((fp[idx] + tp[idx]), 1)
接着便计算AP值,F1等,ap值计算代码如下:
def voc_ap(rec, prec):
    """
    --- Official matlab code VOC2012---
    mrec=[0 ; rec ; 1];
    mpre=[0 ; prec ; 0];
    for i=numel(mpre)-1:-1:1
            mpre(i)=max(mpre(i),mpre(i+1));
    end
    i=find(mrec(2:end)~=mrec(1:end-1))+1;
    ap=sum((mrec(i)-mrec(i-1)).*mpre(i));
    """
    rec.insert(0, 0.0) # insert 0.0 at begining of list
    rec.append(1.0) # insert 1.0 at end of list
    mrec = rec[:]
    prec.insert(0, 0.0) # insert 0.0 at begining of list
    prec.append(0.0) # insert 0.0 at end of list
    mpre = prec[:]
    """
     This part makes the precision monotonically decreasing
        (goes from the end to the beginning)
        matlab: for i=numel(mpre)-1:-1:1
                    mpre(i)=max(mpre(i),mpre(i+1));
    """
    for i in range(len(mpre)-2, -1, -1):
        mpre[i] = max(mpre[i], mpre[i+1])
    """
     This part creates a list of indexes where the recall changes
        matlab: i=find(mrec(2:end)~=mrec(1:end-1))+1;
    """
    i_list = []
    for i in range(1, len(mrec)):
        if mrec[i] != mrec[i-1]:
            i_list.append(i) # if it was matlab would be i + 1
    """
     The Average Precision (AP) is the area under the curve
        (numerical integration)
        matlab: ap=sum((mrec(i)-mrec(i-1)).*mpre(i));
    """
    ap = 0.0
    for i in i_list:
        ap += ((mrec[i]-mrec[i-1])*mpre[i])
    return ap, mrec, mpre
最终将所有AP值计算出后累加,除以class_num即可得到mAP了。
最终输出结果:
