3.机器学习模型代码——逻辑回归代码案例工作实操
import numpy as np
import pandas as pd
import math
df=pd.read_excel("data.xlsx",dtype=str)
df.describe()
| 随机值 | 公司Id | 时间内注册公司数量(月) | 注册地址重合 | 关联公司涉案 | 法人有涉案记录(总次数) | 社保人数 | 纳税金额 | 法人过境记录 | 预测结果 | 属性 | |
|---|---|---|---|---|---|---|---|---|---|---|---|
| count | 4723 | 4723 | 4723 | 4723 | 4723 | 4723 | 4723 | 4723 | 4723 | 4723 | 4723 |
| unique | 3044 | 4723 | 20 | 20 | 20 | 20 | 472 | 97 | 51 | 3 | 3 |
| top | 2988 | company_S250 | 9 | 9 | 9 | 9 | 10 | 30001 | 1 | 高风险 | 高风险 |
| freq | 5 | 1 | 385 | 373 | 420 | 430 | 218 | 1821 | 418 | 2214 | 2214 |
# 映射属性标签为数值型
# df.columns.tolist()
df['label']=df.属性

list_k=[ '高风险','中风险','低风险']
list_v=[0,1,2]
replace_dict_T=dict(zip(list_k,list_v))
# replace_dict={
#     '高风险':0,
#     '中风险':1,
#     '低风险':2
# }

df['label']=df['label'].replace(replace_dict_T)

X_col=[
 '时间内注册公司数量(月)',
 '注册地址重合',
 '关联公司涉案',
 '法人有涉案记录(总次数)',
 '社保人数',
 '纳税金额',
 '法人过境记录']
Y_col=['label']

data_X=df[X_col]
data_Y=df[Y_col]
# 数据分割包
from sklearn.model_selection import  train_test_split
tran_x,test_x,tran_y,test_y = train_test_split(data_X,data_Y,test_size=0.2,random_state=42)##train打错了
# X_train, X_test, y_train, y_test


# 归一化
# X_train_scaled = scaler.fit_transform(X_train)
# # 对于测试集 transform
# X_test_scaled = scaler.transform(X_test)

from sklearn.preprocessing import MinMaxScaler
scaler = MinMaxScaler()

tran_x_mms=scaler.fit_transform(tran_x)
tran_x=pd.DataFrame(tran_x_mms,columns=tran_x.columns,index=tran_x.index)


test_x_mms= scaler.transform(test_x)
test_x=pd.DataFrame(test_x_mms,columns=test_x.columns,index=test_x.index)
# penalty='l2',
#     *,
#     dual=False,
#     tol=0.0001,
#     C=1.0,
#     fit_intercept=True,
#     intercept_scaling=1,
#     class_weight=None,
#     random_state=None,
#     solver='lbfgs',
#     max_iter=100,
#     multi_class='auto',
#     verbose=0,
#     warm_start=False,
#     n_jobs=None,
#     l1_ratio=None,
#Penalty 证则化方法 L1 l2 避免果过拟合 ,solver 损失函数
#fit_intercept 常数项
#multi_class 多分类时 ovr快,精度低;Multinomial慢,精度高。
#solver 损失函数


from sklearn.linear_model import LogisticRegression

model_LR = LogisticRegression(multi_class ="ovr") #fit_intercept 是否有常数项
model_LR_result=model_LR.fit(tran_x,tran_y['label'])
import joblib
joblib.dump(model_LR_result,'model_LR_result.model')
joblib.dump(model_LR,'model_LR.model')
['model_LR.model']
model_LR_result=joblib.load('model_LR_result.model')#方法1
model_LR_result.score(test_x,test_y.label)
0.9957671957671957
model_LR=joblib.load('model_LR.model')# 方法2  好像无差别
model_LR.score(test_x,test_y.label)
0.9957671957671957
model_LR.score(test_x,test_y.label)# 线性回归评估R方,这里是逻辑回归,反馈准确率 TP+TN /(TP+TN+FP+FN)
0.9957671957671957
model_LR_result.score(test_x,test_y.label)
0.9957671957671957
model_LR.intercept_ #常数
array([-11.6231361 , 12.79875732, -0.89777407])
model_LR.coef_ #自变量系数
array([[  5.6309648 ,   5.62347158,   5.48403264,   5.67384969,
         -1.18884631,  -2.99224363,  -4.67750801],
       [ -5.20140083,  -5.11971276,  -4.73876587,  -5.25461372,
        -12.56693517,  -9.59923801,  -2.84616222],
       [ -3.39898562,  -3.47248496,  -3.58589493,  -3.443863  ,
          4.14845207,   4.4702302 ,   4.78672576]])
# 初次训练数据结果

model_result=pd.DataFrame(model_LR.coef_,columns=test_x.columns)
model_result['intercept_']=list(model_LR.intercept_)
model_result['index_labels']=model_result.index
replace_dict_F=dict(zip(list_v,list_k))
model_result.index_labels=model_result.index_labels.replace(replace_dict)
model_result
| 时间内注册公司数量(月) | 注册地址重合 | 关联公司涉案 | 法人有涉案记录 | 社保人数 | 纳税金额 | 法人过境记录 | intercept_ | index_labels | |
|---|---|---|---|---|---|---|---|---|---|
| 0 | 5.587753 | 5.635286 | 5.478135 | 5.625104 | -1.183990 | -3.004709 | -4.720270 | -11.567265 | 高风险 |
| 1 | -5.177832 | -5.174578 | -4.871483 | -5.276716 | -12.674818 | -9.616986 | -2.893329 | 12.919748 | 中风险 |
| 2 | -3.368405 | -3.469166 | -3.546208 | -3.404291 | 4.164478 | 4.501468 | 4.782409 | -0.967546 | 低风险 |
model_result=pd.DataFrame(model_LR.coef_,columns=test_x.columns)
model_result['intercept_']=list(model_LR.intercept_)
model_result['index_labels']=model_result.index
replace_dict_F=dict(zip(list_v,list_k))
model_result.index_labels=model_result.index_labels.replace(replace_dict_F)
model_result
| 时间内注册公司数量(月) | 注册地址重合 | 关联公司涉案 | 法人有涉案记录(总次数) | 社保人数 | 纳税金额 | 法人过境记录 | intercept_ | index_labels | |
|---|---|---|---|---|---|---|---|---|---|
| 0 | 5.630965 | 5.623472 | 5.484033 | 5.673850 | -1.188846 | -2.992244 | -4.677508 | -11.623136 | 高风险 |
| 1 | -5.201401 | -5.119713 | -4.738766 | -5.254614 | -12.566935 | -9.599238 | -2.846162 | 12.798757 | 中风险 |
| 2 | -3.398986 | -3.472485 | -3.585895 | -3.443863 | 4.148452 | 4.470230 | 4.786726 | -0.897774 | 低风险 |
model_result.to_excel("model_result2.xlsx")
model_LR.predict_proba(test_x) #预测概率
array([[3.78030207e-02, 9.48181444e-01, 1.40155350e-02],
       [9.94926758e-01, 5.06952949e-03, 3.71298332e-06],
       [9.89677711e-01, 1.03152866e-02, 7.00245255e-06],
       ...,
       [9.93431508e-01, 6.56411707e-03, 4.37517777e-06],
       [2.80925603e-07, 6.51573726e-02, 9.34842346e-01],
       [9.71592306e-01, 2.84018962e-02, 5.79741552e-06]])
test_y['predict']=model_LR.predict(test_x)
test_y['label_ch']=test_y.label.replace(replace_dict_F)
test_y['predict_ch']=test_y['predict'].replace(replace_dict_F)
pd.crosstab(test_y['predict'].values,test_y.label.values)# 行名model_LR.predict(test_x) 混淆矩阵
| col_0 | 0 | 1 | 2 |
|---|---|---|---|
| row_0 | |||
| 0 | 438 | 0 | 0 |
| 1 | 0 | 265 | 7 |
| 2 | 0 | 0 | 235 |
df_roc=pd.crosstab(test_y.label_ch.values,test_y.predict_ch.values)# 列名model_LR.predict(test_x) 混淆矩阵
df_roc.loc[list_k,list_k]
| col_0 | 高风险 | 中风险 | 低风险 |
|---|---|---|---|
| row_0 | |||
| 高风险 | 420 | 0 | 0 |
| 中风险 | 0 | 266 | 0 |
| 低风险 | 0 | 4 | 255 |
test_y.label.value_counts() #验证行名为真实值
0    420
1    266
2    259
Name: label, dtype: int64
from sklearn.metrics import confusion_matrix # 混淆矩阵包
arr=confusion_matrix(test_y.label_ch.values,test_y.predict_ch.values,labels=list_k)
pd.DataFrame(arr,index=list_k,columns=list_k)
| 高风险 | 中风险 | 低风险 | |
|---|---|---|---|
| 高风险 | 420 | 0 | 0 |
| 中风险 | 0 | 266 | 0 |
| 低风险 | 0 | 4 | 255 |
from sklearn.metrics import accuracy_score#准确度
from sklearn.metrics import precision_score#查准率
from sklearn.metrics import recall_score#查全率
from sklearn.metrics import f1_score#F1值
from sklearn.metrics import classification_report#分类报告
from sklearn.metrics import confusion_matrix#混淆矩阵
from sklearn.metrics import roc_curve#ROC曲线
from sklearn.metrics import auc#ROC曲线下的面积

# from sklearn.metrics import specificity_score 无这个包
# accuracy_score()#准确度
# precision_score()#查准率
# recall_score()#查全率
# f1_score()#F1值
# classification_report()#分类报告
# # confusion_matrix#混淆矩阵
# roc_curve()#ROC曲线
# auc()#ROC曲线下的面积
#由于是三分类 全部变成了对0类的评估

print("准确度(率)accuracy_score:",accuracy_score(test_y.label_ch.values,test_y.predict_ch.values))
print("精确率precision_score:",precision_score(test_y.label_ch.values,test_y.predict_ch.values,average='micro'))
print("召回率recall_score:",recall_score(test_y.label_ch.values,test_y.predict_ch.values,average='micro'))

print("F f1_score:",f1_score(test_y.label_ch.values,test_y.predict_ch.values,average='micro'))
准确度(率)accuracy_score: 0.9957671957671957
精确率precision_score: 0.9957671957671957
召回率recall_score: 0.9957671957671957
F f1_score: 0.9957671957671957
print(classification_report(test_y.label_ch.values,test_y.predict_ch.values))
              precision    recall  f1-score   support

         中风险       0.99      1.00      0.99       266
         低风险       1.00      0.98      0.99       259
         高风险       1.00      1.00      1.00       420

    accuracy                           1.00       945
   macro avg       1.00      0.99      0.99       945
weighted avg       1.00      1.00      1.00       945
# import matplotlib.pyplot as plt
# rng = np.random.RandomState(1) # 设置随机种子
# x = 5*rng.rand(100) # 100个[0,5)的随机数
# y = 2*x-5+rng.randn(100) # 真实规律的标签取值
# X = pd.DataFrame(x)
# Y = pd.DataFrame(y)
# ex = pd.DataFrame(np.ones([100,1])) #添加一列权威1的列,表示截距
# data = pd.concat([ex,X,Y],axis=1)
# plt.scatter(X, y,alpha=0.3)
# plt.show()
import matplotlib.pyplot as plt
import numpy as np


# 散点图是看两个变量之间的关系
X = 2 * np.random.rand(100, 1)
y = 4 + 3 * X + np.random.randn(100, 1)
# plt.plot(x, np.cos(x), ':b', label='cos(x)')

plt.scatter(X, y,alpha=0.3)
plt.show()
df_reselt=pd.concat([test_x,test_y ],axis=1)
df_reselt_0=df_reselt[df_reselt.label_ch=="高风险"]
df_reselt_1=df_reselt[df_reselt.label_ch=="中风险"]
df_reselt_2=df_reselt[df_reselt.label_ch=="低风险"]


# df_reselt=pd.concat([test_x,test_y ],axis=1)
p_df_reselt_0=df_reselt[df_reselt.predict_ch=="高风险"]
p_df_reselt_1=df_reselt[df_reselt.predict_ch=="中风险"]
p_df_reselt_2=df_reselt[df_reselt.predict_ch=="低风险"]
# from sklearn.model_selection import  train_test_split
# tran_x,test_x,tran_y,test_y = train_test_split(data_X,data_Y,test_size=0.2,random_state=42)
df_load=pd.read_excel(r'E:\2021_project_wang\999 jupyter 代码\093.工商模型\data_Max_min.xlsx')
df_load_0=df_load[df_load.属性=="高风险"]
df_load_1=df_load[df_load.属性=="中风险"]
df_load_2=df_load[df_load.属性=="低风险"]
# df_reselt
# 散点图是看两个变量之间的关系
# X = 2 * np.random.rand(100, 1)
# y = 4 + 3 * X + np.random.randn(100, 1)
# plt.plot(x, np.cos(x), ':b', label='cos(x)')

# y2=3*x
# y3=4*x
# plt.plot(x,y,x,y2)
# plt.plot(x,y3)


X_1=df_load_0['关联公司涉案'].values[:40]
X_2=df_load_0.纳税金额.values[:40]


X_3=df_load_1['关联公司涉案'].values[:40]
X_4=df_load_1.纳税金额.values[:40]


X_5=df_load_2['关联公司涉案'].values[:40]
X_6=df_load_2.纳税金额.values[:40]

plt.scatter(X_1,X_2,marker="^",c='red',alpha=1)
plt.scatter(X_3,X_4,marker="+",c='green',alpha=1)
plt.scatter(X_5,X_6,marker=".",alpha=1)


x = np.linspace(0,1,50)#从(-1,1)均匀取50个点
y1 = 0.05*x+0.2
y2=0.1*x

# plt.yticks([i for i in range(1,101500)])
# plt.plot(x,y1,c="red",alpha=1)
# plt.plot(x,y2,alpha=1)
plt.xlabel("x1")
plt.ylabel("x2")
plt.show()
# 散点图是看两个变量之间的关系
# X = 2 * np.random.rand(100, 1)
# y = 4 + 3 * X + np.random.randn(100, 1)
# plt.plot(x, np.cos(x), ':b', label='cos(x)')

# y2=3*x
# y3=4*x
# plt.plot(x,y,x,y2)
# plt.plot(x,y3)
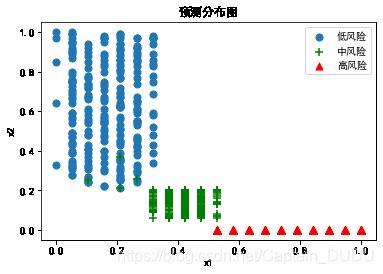
plt.rcParams['font.sans-serif']=['SimHei'] #用来正常显示中文标签

X_1=p_df_reselt_0['关联公司涉案'].values
X_2=p_df_reselt_0.纳税金额.values


X_3=p_df_reselt_1['关联公司涉案'].values
X_4=p_df_reselt_1.纳税金额.values


X_5=p_df_reselt_2['关联公司涉案'].values
X_6=p_df_reselt_2.纳税金额.values
plt.scatter(X_5,X_6,marker="o",label='低风险',alpha=1,s=50)
plt.scatter(X_3,X_4,marker="+",c='green',alpha=1,label='中风险',s=50)#"V,alpha=1"
plt.scatter(X_1,X_2,marker="^",c='red',alpha=1,label='高风险',s=50)


x = np.linspace(0,1,50)#从(-1,1)均匀取50个点
y1 = 0.05*x+0.2
y2=0.1*x
# plt.plot(x,y1,c="red",alpha=1)
# plt.plot(x,y2,alpha=1)

# plt.figure().add_subplot().set_title('Scatter Plot')
plt.xlabel("x1")
plt.ylabel("x2")
# fig = plt.figure()

# ax1 = fig.add_subplot(111)

# #设置标题

# ax1.set_title('Scatter Plot')

plt.title('预测分布图') # 'Scatter'为图的标题
plt.legend(loc = 'upper right')#图例位于 左上角
# plt.xticks(x)

plt.show()
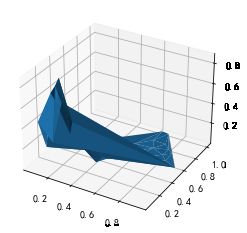
fig = plt.figure()
ax = fig.add_subplot(111,projection='3d')
# x =np.array()//点的横坐标,比如[1,1,1,2,2,2,3,3,3]
# y= np.array()//点的横坐标,比如[4,5,6,4,5,6,4,5,6]
# z =np.array()//点的竖坐标,比如[........]
X=test_x['时间内注册公司数量(月)'].values[:40]
Y=test_x.注册地址重合.values[:40]
Z=test_x.社保人数.values[:40]

ax.plot_trisurf(X,Y,Z)
plt.show()
# import matplotlib as mpl
# from mpl_toolkits.mplot3d import Axes3D
# import numpy as np
# import matplotlib.pyplot as plt

# # mpl.rcParams['legend.fontsize'] = 10

# # fig = plt.figure()
# # ax = fig.gca(projection='3d')
# # theta = np.linspace(-4 * np.pi, 4 * np.pi, 100)
# # z = np.linspace(-2, 2, 100)
# # r = z**2 + 1
# # x = r * np.sin(theta)
# # y = r * np.cos(theta)
# # ax.plot(x, y, z, label='parametric curve')
# # ax.legend()

# # plt.show()


# fig = plt.figure()
# ax = fig.add_subplot(111,projection='3d')
# # x =np.array()//点的横坐标,比如[1,1,1,2,2,2,3,3,3]
# # y= np.array()//点的横坐标,比如[4,5,6,4,5,6,4,5,6]
# # z =np.array()//点的竖坐标,比如[........]
# X=test_x['时间内注册公司数量(月)'].values[:20]
# Y=test_x.注册地址重合.values[:20]
# Z=test_x.社保人数.values[:20]

# for v_i in range(len(X)):
#     x_1
#     y_1
#     z_1


# ax.plot_trisurf(X,Y,Z)
# ax.plot_trisurf(X,Y,Z)

# plt.show()


