获取GeoJSON数据
GeoJSON是一种对各种地理数据结构进行编码的格式。本质就是一个JSON对象。
{
  "type": "Feature",
  "geometry": {
    "type": "Point",
    "coordinates": [125.6, 10.1]
  },
  "properties": {
    "name": "Dinagat Islands"
  }
}
- 主要关心
geometry对象的值,geometry.type几何数据类型(一共有7种),geometry.coordinates数据(不同类型格式不同)。
绘制地图
基础代码
<!DOCTYPE html>
<html lang="en">
<head>
<meta charset="UTF-8" />
<title>学习</title>
</head>
<body>
<canvas id="c2d" class="c2d" width="1000" height="500"></canvas>
<script type="module">
import * as THREE from './file/three.js-dev/build/three.module.js'
import { OrbitControls } from './file/three.js-dev/examples/jsm/controls/OrbitControls.js'
const canvas = document.querySelector('#c2d')
const renderer = new THREE.WebGLRenderer({ canvas })
const fov = 40
const aspect = 2
const near = 0.1
const far = 10000
const camera = new THREE.PerspectiveCamera(fov, aspect, near, far)
camera.position.set(0, 0, 300)
camera.lookAt(0, 0, 0)
const controls = new OrbitControls(camera, canvas)
controls.update()
const scene = new THREE.Scene()
{
const color = 0xffffff
const intensity = 1
const light = new THREE.AmbientLight(color, intensity)
scene.add(light)
}
function render() {
renderer.render(scene, camera)
requestAnimationFrame(render)
}
requestAnimationFrame(render)
</script>
</body>
</html>
加载几何信息数据
THREE.FileLoader() 用于加载任何没有对应加载器的文件类型。
      const loader = new THREE.FileLoader()
      loader.load('./file/100000_full.json', (data) => {
        const jsondata = JSON.parse(data)
        console.log('jsondata', jsondata)
      })

- 每个省的数据是分开的,会多次创建图形。创建图形公用方法。
.Shape()形状的使用,可以查看上一节。
function drawExtrudeMesh(polygon, color) {
const shape = new THREE.Shape()
polygon.forEach((row, i) => {
const [x, y] = [row[0], row[1]]
if (i === 0) {
shape.moveTo(x, y)
}
shape.lineTo(x, y)
})
const geometry = new THREE.ExtrudeGeometry(shape, {
depth: 10,
bevelEnabled: false
})
const material = new THREE.MeshBasicMaterial({
color: color,
transparent: true,
opacity: 0.5
})
return new THREE.Mesh(geometry, material)
}
var axes = new THREE.AxisHelper(700)
scene.add(axes)
const map = new THREE.Object3D()
function operationData(jsondata) {
const features = jsondata.features
features.forEach((feature) => {
const province = new THREE.Object3D()
province.properties = feature.properties.name
const coordinates = feature.geometry.coordinates
const color = 'yellow'
if (feature.geometry.type === 'MultiPolygon') {
coordinates.forEach((coordinate) => {
coordinate.forEach((rows) => {
const mesh = drawExtrudeMesh(rows, color)
province.add(mesh)
})
})
}
if (feature.geometry.type === 'Polygon') {
coordinates.forEach((coordinate) => {
const mesh = drawExtrudeMesh(coordinate, color)
province.add(mesh)
})
}
map.add(province)
})
scene.add(map)
}

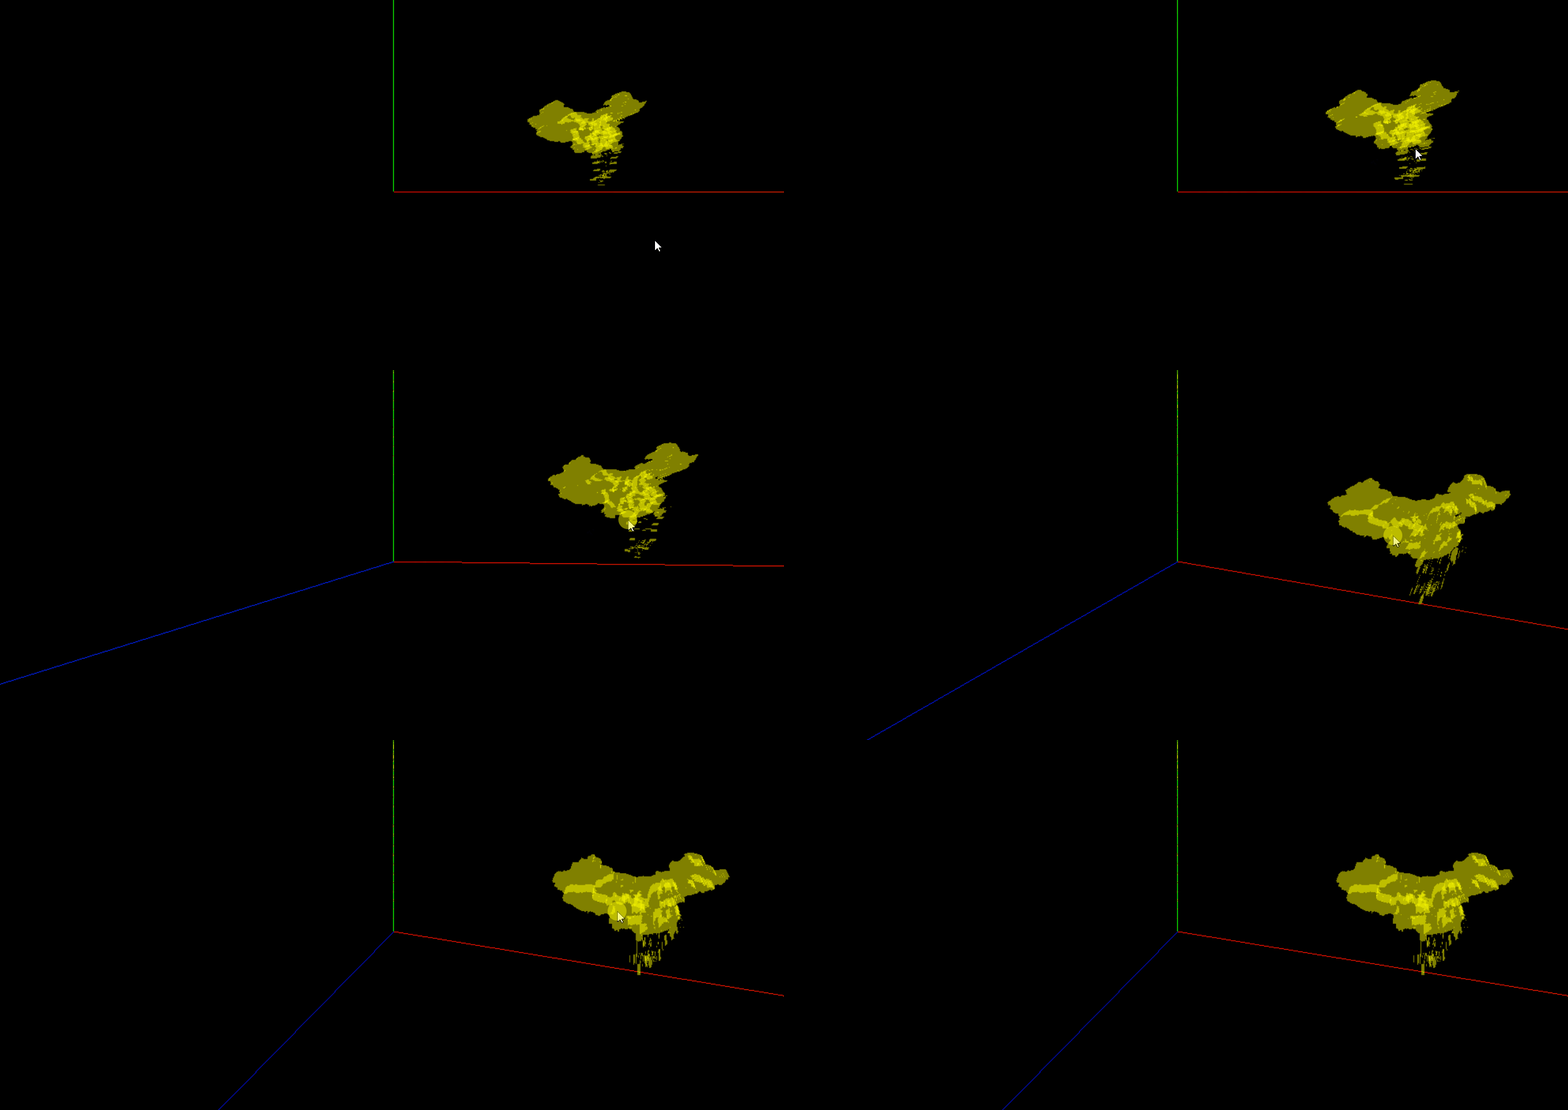
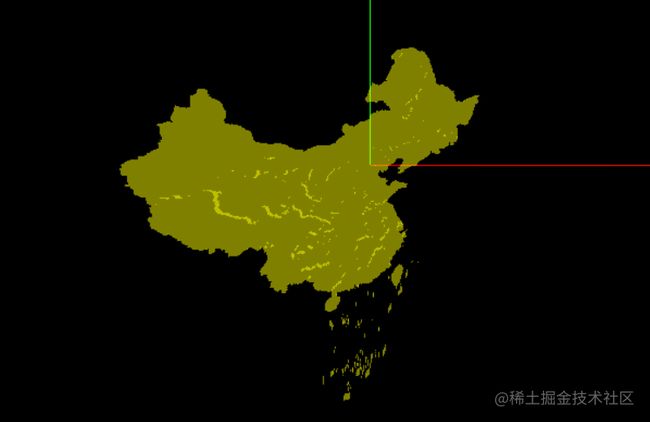
- 一个简单的中国地图就绘制好了,可以看见绘制点不是原点且省份之间边界不明显。
优化地图
- 引入
d3.geoMercator()经纬度坐标转换。使用第三方控件帮助我们计算坐标转换。
...
<script src="https://d3js.org/d3.v5.min.js"></script>
...
const projection = d3.geoMercator().center([116.412318, 39.909843]).translate([0, 0])
...
- 修改
drawExtrudeMesh()函数,坐标转换部分。
    polygon.forEach((row, i) => {
      const [x, y] = projection(row)
      if (i === 0) {
        shape.moveTo(x, -y)
      }
      shape.lineTo(x, -y)
    })

function lineDraw(polygon, color) {
const lineGeometry = new THREE.BufferGeometry()
const pointsArray = new Array()
polygon.forEach((row) => {
const [x, y] = projection(row)
pointsArray.push(new THREE.Vector3(x, -y, 9))
})
lineGeometry.setFromPoints(pointsArray)
const lineMaterial = new THREE.LineBasicMaterial({
color: color
})
return new THREE.Line(lineGeometry, lineMaterial)
}
- 修改
.operationData()方法,在绘制立体图像(drawExtrudeMesh(rows, color))的后面绘制边框图形。
coordinate.forEach((rows) => {
const mesh = drawExtrudeMesh(rows, color)
const line = lineDraw(rows, color)
province.add(line)
province.add(mesh)
})
其他操作
- 在数据操作方法中,我们还可以根据省份名字做一些特殊操作。比如修改省份颜色等。
const color = ['重庆市', '上海市'].includes(feature.properties.name) ? 'blue' : 'yellow'

- 一个可视化地图还有很多功能,比如绘制飞线图、选中省市高亮等。后面在进行了解。
- 代码地址


