基于ricequant隐马尔科夫模型量化交易
看到我这篇文章,相信您已经是有一定的数学基础的,隐马尔科夫模型的介绍这里不做赘述。
目录
ricequant研究平台训练模型
回测框架测试结果
ricequant研究平台训练模型
我们假设隐藏状态数量是6,即假设股市的状态有6种,虽然我们并不知道每种状态到底是什么,但是通过后面的图我们可以看出那种状态下市场是上涨的,哪种是震荡的,哪种是下跌的。可观测的特征状态我们选择了3个指标进行标示,进行预测的时候假设假设所有的特征向量的状态服从高斯分布,这样就可以使用 hmmlearn 这个包中的 GaussianHMM 进行预测了。下面我会逐步解释。
首先导入必要的包:
from hmmlearn.hmm import GaussianHMM
import numpy as np
from matplotlib import cm, pyplot as plt
import matplotlib.dates as dates
import pandas as pd
import datetime
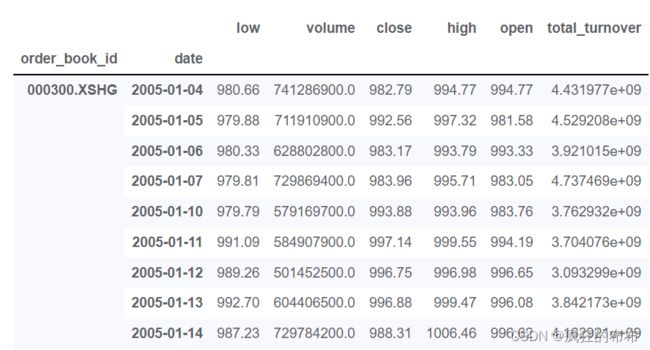
测试时间从2005年1月1日到2015年12月31日,拿到每日沪深300的各种交易数据。
beginDate = '2005-01-01'
endDate = '2015-12-31'
n = 6 #6个隐藏状态
data = get_price('000300.XSHG',start_date=beginDate, end_date=endDate,frequency='1d')
data[0:9]
拿到每日成交量和收盘价的数据。
volume = data['volume']
close = data['close']
logDel = np.log(np.array(data['high'])) - np.log(np.array(data['low']))
logDel

logRet_1 = np.array(np.diff(np.log(close)))#这个作为后面计算收益使用
logRet_5 = np.log(np.array(close[5:])) - np.log(np.array(close[:-5]))
logRet_5

logVol_5 = np.log(np.array(volume[5:])) - np.log(np.array(volume[:-5]))
logVol_5

logDel = logDel[5:]
logRet_1 = logRet_1[4:]
close = close[5:]
Date = pd.to_datetime(data.reset_index()["date"][5:])
合并成训练数据
A = np.column_stack([logDel,logRet_5,logVol_5])
A
将数据送入模型,进行6分类隐马尔科夫预测
model = GaussianHMM(n_components= n, covariance_type="full", n_iter=2000).fit(A)
hidden_states = model.predict(A)
hidden_states
将预测的6个分类图形画,从图中可观测出红色点阵代表牛市,绿色代表熊市,其他颜色反应微涨微跌的,震荡等市场格局
plt.figure(figsize=(25, 18))
for i in range(model.n_components):
    pos = (hidden_states==i)
    plt.plot_date(Date[pos],close[pos],'o',label='hidden state %d'%i,lw=2)
    #plt.legend(loc="left")
从图中可以比较明显的看出绿色的隐藏状态代表指数大幅上涨,浅蓝色和黄色的隐藏状态代表指数下跌。
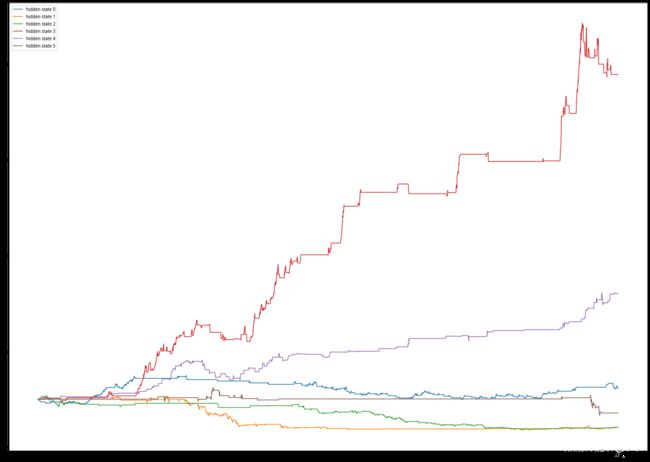
为了更直观的表现不同的隐藏状态分别对应了什么,我们采取获得隐藏状态结果后第二天进行买入的操作,这样可以看出每种隐藏状态代表了什么。
从图中可以看出在状态3和状态4做多可以获得较高收益,状态1和状态2做空可以获得较小损失
long = (hidden_states==3) + (hidden_states == 4) #做多
short = (hidden_states==1) + (hidden_states == 2)  #做空
long = np.append(0,long[:-1]) #第二天才能操作
short = np.append(0,short[:-1]) #第二天才能操作
res['ret'] = df.multiply(long) - df.multiply(short)
plt.plot_date(Date,np.exp(res['ret'].cumsum()),'r-')最后保存模型
#保存模型
import pickle

# 保存模型
with open('hmm.txt', 'wb') as f:
    pickle.dump(model, f)

# 读取模型
with open('hmm.txt', 'rb') as f:
    hmm = pickle.load(f)
回测框架测试结果
import pickle
from six import BytesIO
from rqfactor import *
import rqdatac
import datetime
import numpy as np
# 在这个方法中编写任何的初始化逻辑。context对象将会在你的算法策略的任何方法之间做传递。
def init(context):
    context.stocklist = []
    body = get_file('hmm.txt')
    context.dict_model = pickle.load(BytesIO(body))
    context.hs300 = "000300.XSHG"

# before_trading此函数会在每天策略交易开始前被调用,当天只会被调用一次
def before_trading(context):
    pass


# 你选择的证券的数据更新将会触发此段逻辑,例如日或分钟历史数据切片或者是实时数据切片更新
def handle_bar(context, bar_dict):
    cnt = 16
    close = history_bars(context.hs300, cnt, '1d', 'close')
    high = history_bars(context.hs300, cnt, '1d', 'high')
    low = history_bars(context.hs300, cnt, '1d', 'low')
    volume = history_bars(context.hs300, cnt, '1d', 'volume')

    print(context.now)
    print(close)
    print(high)

    logDel = np.log(high) - np.log(low)
    logRet_5 = np.log(close[5:]) - np.log(close[:-5])
    logVol_5 = np.log(volume[5:]) - np.log(volume[:-5])
    logDel = logDel[5:]

    B = np.column_stack([logDel,logRet_5,logVol_5])
    ret = context.dict_model.predict(B)
    print(B)
    print(ret)

    if ret[-1] == 1 or ret[-1] == 2:
        for stock in context.portfolio.positions.keys():
            if context.portfolio.positions[stock].quantity > 0:
                order_target_percent(stock, 0)

    if ret[-1] == 3:
        order_target_percent(context.hs300, 1)

# after_trading函数会在每天交易结束后被调用,当天只会被调用一次
def after_trading(context):
    pass
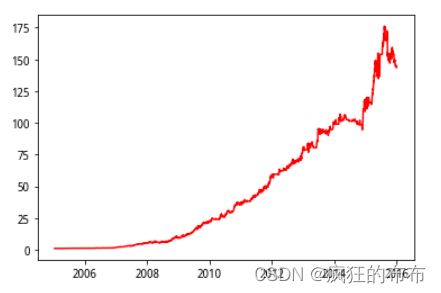
隐马尔科夫过往10年收益曲线


