如何使用OpenCV进行Delaunay三角剖分和Voronoi图
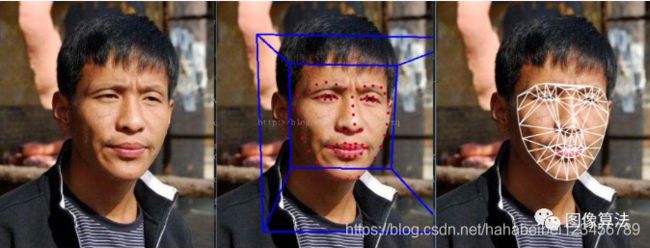
图1.左:使用dlib检测到具有标志性建筑的奥巴马总统图像。中心:地标的Delaunay三角剖分。右:对应的Voronoi图。
俄国数学家鲍里斯·尼古拉耶维奇·德劳内(Boris Nikolaevich Delaunay)用两种不同的方式拼写了他的姓氏-法劳德出版社的德劳内和其他地方的德隆。很少有人拥有以他们命名的算法或概念。但是Delaunay有一个数学概念是以他姓氏的每次拼写来命名的!— Delaunay三角剖分和Delone集。似乎还不够,到1913年,他成为俄罗斯三大登山家之一!
Delaunay博士 顾问是乔治·沃罗诺伊(Georgy Voronoy),后被命名为沃罗诺伊图。还有另一个有趣的琐事-Voronoy的博士学位。顾问是安德烈·马可夫(Andrey Markov)(是的,是马可夫链的马可夫,马可夫成名)。
什么是Delaunay三角剖分?
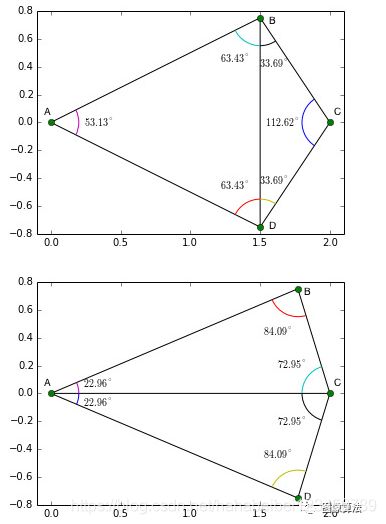
图2:Delaunay三角剖分偏爱小角度
给定平面中的一组点,三角剖分指的是将平面细分为三角形,这些点为顶点。在图1中,我们在左侧图像上看到了一组地标,在中间图像上看到了三角剖分。一组点可以有许多可能的三角剖分,但是Delaunay三角剖分之所以突出是因为它具有一些不错的特性。在Delaunay三角剖分中,选择三角形时应确保没有点位于任何三角形的外接圆之内。图2.显示了四个点A,B,C和D的Delaunay三角剖分。在顶部图像中,为了使该三角剖分成为有效的Delaunay三角剖分,C点应该在三角形ABD的外接圆之外,而A点应该在三角形的外侧。三角形BCD的外接圆。
Delaunay三角剖分的一个有趣特性是它不支持“瘦”三角形(即,一个大角度的三角形)。
图2显示了在移动点时三角剖分如何变化以拾取“胖”三角形。在顶部图像中,点B和D在x = 1.5处具有x坐标,在底部图像中,它们向右移至x = 1.75。在顶部图像角度中,ABC和ABD的角度较大,而Delaunay三角剖分在B和D之间创建了一条边缘,将两个大角度分为较小的角度ABD,ADB,CDB和CBD。另一方面,在底部图像中,角度BCD太大,并且Delaunay三角剖分创建了边缘AC以划分大角度。
有很多算法可以找到一组点的Delaunay三角剖分。最明显(但不是最有效)的方法是从任何三角剖分开始,然后检查任何三角形的外接圆是否包含另一个点。如果是这样,则翻转边缘(如图2所示)并继续直到没有外接圆包含点的三角形。
关于Delaunay三角剖分的任何讨论都必须包括Voronoi图,因为一组点的Voronoi图是其Delaunay三角剖分的数学对偶。
什么是Voronoi图?
图3. Voronoi图
给定平面中的一组点,Voronoi图会划分空间,以使边界线与相邻点等距。图3.显示了根据显示为黑点的点计算的Voronoi图的示例。您会注意到,每条边界线都经过两个点的中心。如果将相邻的Voronoi地区中的点连接起来,则会得到Delaunay三角剖分!
Delaunay三角剖分和Voronoi图之间的联系不止一种。乔治·沃罗诺伊(Georgy Voronoy)是鲍里斯·德劳内(Boris Delaunay)的博士学位。顾问。
给定一组点,您可以使用Subdiv2D类计算Delaunay三角剖分或Voronoi图。步骤如下。下一部分显示了一个完整的工作示例。
1.收集向量中的所有点。
C++
vector points;
// This is how you can add one point.
points.push_back(Point2f(x,y));
Python
points = []
# This is how you can add one point.
points.append((x, y))
2.使用矩形(rect)定义要分区的空间。如果您在上一步中定义的点是在图像上定义的,则此矩形可以是(0,0,width,height)。否则,您可以选择一个包围所有点的矩形。
C++
Mat img = imread("image.jpg");
Size size = img.size();
Rect rect(0, 0, size.width, size.height);
Python
img = cv2.imread("image.jpg");
size = img.shape
rect = (0, 0, size[1], size[0])
3.使用在上一步中获得的矩形创建Subdiv2D实例。
C++
Subdiv2D subdiv(rect);
Python
subdiv = cv2.Subdiv2D(rect);
4.使用subdiv.insert(point)将点插入subdiv中。上面的视频显示了在细分中添加点时的三角剖分动画。
5.使用subdiv.getTriangleList获取Delaunay三角形的列表。
6.使用subdiv.getVoronoiFacetList获取Voronoi构面的列表。
Delaunay三角剖分和Voronoi图的OpenCV示例
这是一个完整的工作示例。我已经从OpenCV附带的示例中复制了一些代码,并对其进行了简化和修改,以适应我们的目的。OpenCV附带的python示例使用旧的(丑陋的)接口,因此我从头开始编写了它。此代码假定图像存储在image.jpg中,点存储在points.txt中。points.txt的每一行都包含一个点的x和y坐标,这些点之间用空格隔开。例如
207 242
210 269
214 297
220 322
229 349
C ++示例
#include
#include
#include
#include

using namespace cv;
using namespace std;

// Draw a single point
static void draw_point( Mat& img, Point2f fp, Scalar color )
{
    circle( img, fp, 2, color, CV_FILLED, CV_AA, 0 );
}

// Draw delaunay triangles
static void draw_delaunay( Mat& img, Subdiv2D& subdiv, Scalar delaunay_color )
{

    vector triangleList;
    subdiv.getTriangleList(triangleList);
    vector pt(3);
    Size size = img.size();
    Rect rect(0,0, size.width, size.height);

    for( size_t i = 0; i < triangleList.size(); i++ )
    {
        Vec6f t = triangleList[i];
        pt[0] = Point(cvRound(t[0]), cvRound(t[1]));
        pt[1] = Point(cvRound(t[2]), cvRound(t[3]));
        pt[2] = Point(cvRound(t[4]), cvRound(t[5]));

        // Draw rectangles completely inside the image.
        if ( rect.contains(pt[0]) && rect.contains(pt[1]) && rect.contains(pt[2]))
        {
            line(img, pt[0], pt[1], delaunay_color, 1, CV_AA, 0);
            line(img, pt[1], pt[2], delaunay_color, 1, CV_AA, 0);
            line(img, pt[2], pt[0], delaunay_color, 1, CV_AA, 0);
        }
    }
}

//Draw voronoi diagram
static void draw_voronoi( Mat& img, Subdiv2D& subdiv )
{
    vector > facets;
    vector centers;
    subdiv.getVoronoiFacetList(vector(), facets, centers);

    vector ifacet;
    vector > ifacets(1);

    for( size_t i = 0; i < facets.size(); i++ )
    {
        ifacet.resize(facets[i].size());
        for( size_t j = 0; j < facets[i].size(); j++ )
            ifacet[j] = facets[i][j];

        Scalar color;
        color[0] = rand() & 255;
        color[1] = rand() & 255;
        color[2] = rand() & 255;
        fillConvexPoly(img, ifacet, color, 8, 0);

        ifacets[0] = ifacet;
        polylines(img, ifacets, true, Scalar(), 1, CV_AA, 0);
        circle(img, centers[i], 3, Scalar(), CV_FILLED, CV_AA, 0);
    }
}


int main( int argc, char** argv)
{

    // Define window names
    string win_delaunay = "Delaunay Triangulation";
    string win_voronoi = "Voronoi Diagram";

    // Turn on animation while drawing triangles
    bool animate = true;

    // Define colors for drawing.
    Scalar delaunay_color(255,255,255), points_color(0, 0, 255);

    // Read in the image.
    Mat img = imread("image.jpg");

    // Keep a copy around
    Mat img_orig = img.clone();

    // Rectangle to be used with Subdiv2D
    Size size = img.size();
    Rect rect(0, 0, size.width, size.height);

    // Create an instance of Subdiv2D
    Subdiv2D subdiv(rect);

    // Create a vector of points.
    vector points;

    // Read in the points from a text file
    ifstream ifs("points.txt");
    int x, y;
    while(ifs >> x >> y)
    {
        points.push_back(Point2f(x,y));
    }

    // Insert points into subdiv
    for( vector::iterator it = points.begin(); it != points.end(); it++)
    {
        subdiv.insert(*it);
        // Show animation
        if (animate)
        {
            Mat img_copy = img_orig.clone();
            // Draw delaunay triangles
            draw_delaunay( img_copy, subdiv, delaunay_color );
            imshow(win_delaunay, img_copy);
            waitKey(100);
        }

    }

    // Draw delaunay triangles
    draw_delaunay( img, subdiv, delaunay_color );

    // Draw points
    for( vector::iterator it = points.begin(); it != points.end(); it++)
    {
        draw_point(img, *it, points_color);
    }

    // Allocate space for Voronoi Diagram
    Mat img_voronoi = Mat::zeros(img.rows, img.cols, CV_8UC3);

    // Draw Voronoi diagram
    draw_voronoi( img_voronoi, subdiv );

    // Show results.
    imshow( win_delaunay, img);
    imshow( win_voronoi, img_voronoi);
    waitKey(0);

    return 0;
}
Python
#!/usr/bin/python

import cv2
import numpy as np
import random

# Check if a point is inside a rectangle
def rect_contains(rect, point) :
    if point[0] < rect[0] :
        return False
    elif point[1] < rect[1] :
        return False
    elif point[0] > rect[2] :
        return False
    elif point[1] > rect[3] :
        return False
    return True

# Draw a point
def draw_point(img, p, color ) :
    cv2.circle( img, p, 2, color, cv2.cv.CV_FILLED, cv2.CV_AA, 0 )


# Draw delaunay triangles
def draw_delaunay(img, subdiv, delaunay_color ) :

    triangleList = subdiv.getTriangleList();
    size = img.shape
    r = (0, 0, size[1], size[0])

    for t in triangleList :

        pt1 = (t[0], t[1])
        pt2 = (t[2], t[3])
        pt3 = (t[4], t[5])

        if rect_contains(r, pt1) and rect_contains(r, pt2) and rect_contains(r, pt3) :

            cv2.line(img, pt1, pt2, delaunay_color, 1, cv2.CV_AA, 0)
            cv2.line(img, pt2, pt3, delaunay_color, 1, cv2.CV_AA, 0)
            cv2.line(img, pt3, pt1, delaunay_color, 1, cv2.CV_AA, 0)


# Draw voronoi diagram
def draw_voronoi(img, subdiv) :

    ( facets, centers) = subdiv.getVoronoiFacetList([])

    for i in xrange(0,len(facets)) :
        ifacet_arr = []
        for f in facets[i] :
            ifacet_arr.append(f)

        ifacet = np.array(ifacet_arr, np.int)
        color = (random.randint(0, 255), random.randint(0, 255), random.randint(0, 255))

        cv2.fillConvexPoly(img, ifacet, color, cv2.CV_AA, 0);
        ifacets = np.array([ifacet])
        cv2.polylines(img, ifacets, True, (0, 0, 0), 1, cv2.CV_AA, 0)
        cv2.circle(img, (centers[i][0], centers[i][1]), 3, (0, 0, 0), cv2.cv.CV_FILLED, cv2.CV_AA, 0)


if __name__ == '__main__':

    # Define window names
    win_delaunay = "Delaunay Triangulation"
    win_voronoi = "Voronoi Diagram"

    # Turn on animation while drawing triangles
    animate = True

    # Define colors for drawing.
    delaunay_color = (255,255,255)
    points_color = (0, 0, 255)

    # Read in the image.
    img = cv2.imread("image.jpg");

    # Keep a copy around
    img_orig = img.copy();

    # Rectangle to be used with Subdiv2D
    size = img.shape
    rect = (0, 0, size[1], size[0])

    # Create an instance of Subdiv2D
    subdiv = cv2.Subdiv2D(rect);

    # Create an array of points.
    points = [];

    # Read in the points from a text file
    with open("points.txt") as file :
        for line in file :
            x, y = line.split()
            points.append((int(x), int(y)))

    # Insert points into subdiv
    for p in points :
        subdiv.insert(p)

        # Show animation
        if animate :
            img_copy = img_orig.copy()
            # Draw delaunay triangles
            draw_delaunay( img_copy, subdiv, (255, 255, 255) );
            cv2.imshow(win_delaunay, img_copy)
            cv2.waitKey(100)

    # Draw delaunay triangles
    draw_delaunay( img, subdiv, (255, 255, 255) );

    # Draw points
    for p in points :
        draw_point(img, p, (0,0,255))

    # Allocate space for Voronoi Diagram
    img_voronoi = np.zeros(img.shape, dtype = img.dtype)

    # Draw Voronoi diagram
    draw_voronoi(img_voronoi,subdiv)

    # Show results
    cv2.imshow(win_delaunay,img)
    cv2.imshow(win_voronoi,img_voronoi)
    cv2.waitKey(0)
实现效果
相关源码下载地址:关注“图像算法”微信公众号,回复Delaunay,即可获取