【ML实验4】多分类贝叶斯模型
实验代码获取 github repo
山东大学机器学习课程资源索引
实验目的
实验内容
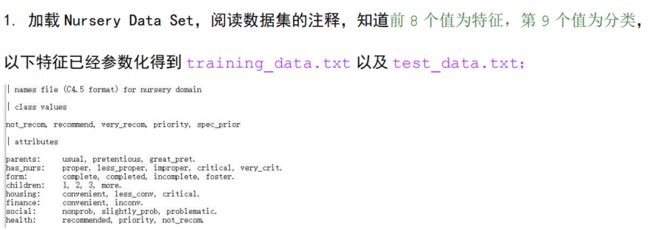
数据集
构建多分类贝叶斯模型
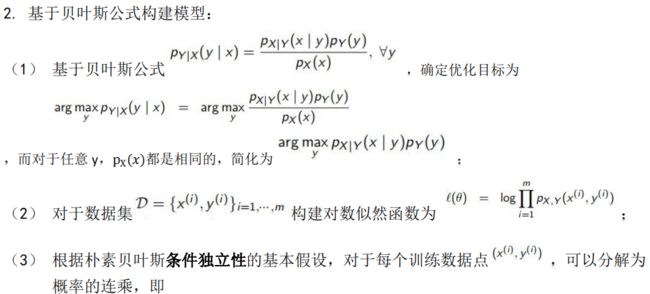

这里的条件独立性指的是特征 x j x_j xj之间相互独立,这是一个十分强的假设。
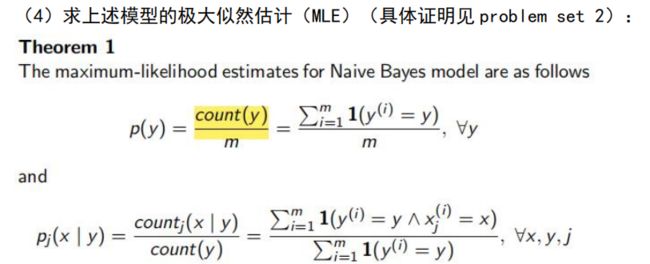
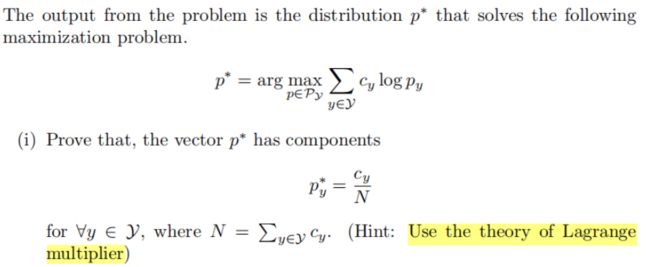
证明 Problem Set 2
思路主要是证明下面引理,用拉格朗日乘子法,对 p y p_y py求偏导变换一下可得。之后将目标似然函数分为两部分,一部分是 ,另一部分是
![]() ,将标签或者特征出现频次视为权重,应用引理即可。
,将标签或者特征出现频次视为权重,应用引理即可。
其实这个结论十分直观,发生多的自然越有可能发生,量化表达,将出现的频率作为对目标函数的贡献。
预测
拉普拉斯平滑
前面构建的模型是朴素贝叶斯,和贝叶斯估计的优化函数有点不同,后者结果在各个取值的频数增加一个 λ \lambda λ,当 l a m b d a = 1 lambda=1 lambda=1时称为拉普拉斯平滑,可以避免0/0的错误。
实验结果
function confusion_matrix(actual,detected)
[mat,order] = confusionmat(actual,detected);

imagesc(mat);            %# Create a colored plot of the matrix values
colormap(flipud(gray));  %# Change the colormap to gray (so higher values are
                         %#   black and lower values are white)

textStrings = num2str(mat(:),'%0.02f');  %# Create strings from the matrix values
textStrings = strtrim(cellstr(textStrings));  %# Remove any space padding

[x,y] = meshgrid(1:5);   %# Create x and y coordinates for the strings
hStrings = text(x(:),y(:),textStrings(:),...      %# Plot the strings
                'HorizontalAlignment','center');
midValue = mean(get(gca,'CLim'));  %# Get the middle value of the color range
textColors = repmat(mat(:) > midValue,1,3);  %# Choose white or black for the
                                             %#   text color of the strings so
                                             %#   they can be easily seen over
                                             %#   the background color
set(hStrings,{'Color'},num2cell(textColors,2));  %# Change the text colors

set(gca,'XTick',1:5,...                         %# Change the axes tick marks
        'XTickLabel',{'0','1','2','3','4'},...  %#   and tick labels
        'YTick',1:5,...
        'YTickLabel',{'0','1','2','3','4'},...
        'TickLength',[0 0]);
xlabel('Real Class');
ylabel('Predict Class');
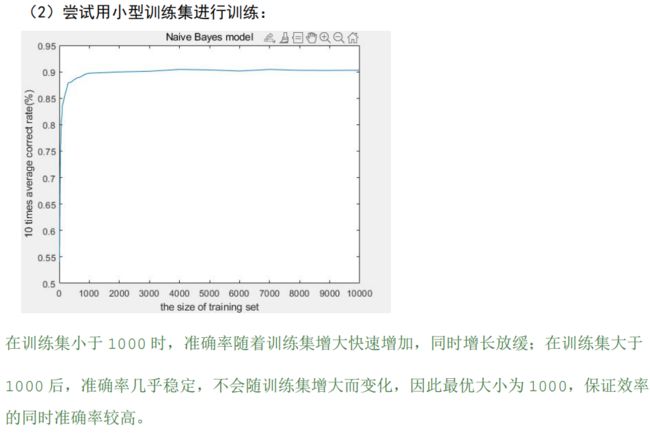
小数据集训练,对贝叶斯模型的效果影响甚微,而且效率上更优,主要是因为贝叶斯模型的训练是基于统计的,这和抛硬币去数正反是一个道理,符合大数定律,当一定硬币抛到一定次数,我们就可以确定正面出现50%,反面出现50%,当然随着标签和特征数增加,这个一定次数也会随之增加,和模型的复杂度相关。又问为什么训练会基于统计,解为什么会是特征或者标签的频率,因为贝叶斯最重要的假设,样本各个特征之间相互独立,没有关联,可以将视作一个个‘1’进行统计。

