【GIS开发】批量下载和拼接地图瓦片(Python)
文章目录
- 1、简介
-
- 1.1 Web墨卡托投影
- 1.2 经纬度坐标系
- 1.3 瓦片定义
- 1.4 瓦片编号
- 1.5 瓦片和像素
- 1.6 瓦片计算公式
- 1.7 网络地图服务(WMS)
- 1.8 切片地图服务(TMS)
- 1.9 切片地图web服务(WMTS)
- 1.10 比例尺
- 2、地图瓦片数据源
- 3、代码实现
- 4、运行结果
-
- 4.1 输出全球图
- 4.2 输出中国图
- 4.3 输出局部图
- 结语
1、简介
1.1 Web墨卡托投影
墨卡托投影,是正轴等角圆柱投影,又称等角圆柱投影,圆柱投影的一种,由荷兰地图学家墨卡托(G. Mercator)于1569年创拟。为地图投影方法中影响最大的。
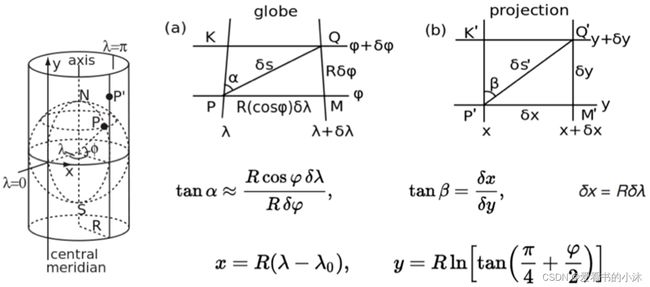
用一张纸卷成圆柱,围住地球仪;然后在地球仪的球心放一个发光的灯泡,地球仪上的地图会在圆柱纸上形成投影;把这张纸平展开,就是我们常见平面世界地图。上面所讲的投影法叫墨卡托投影(Mercator Projection)。

地图学是一门严谨的科学,需要数学模型和精确的公式计算,再做近似处理,墨卡托投影数学模型如下:

当然,地形面积按墨卡托投影投射到平面后是有一定变形的,纬度越高,也就是越靠近两极变形越大。
Web墨卡托投影(又称球体墨卡托投影)是墨卡托投影的变种,它接收的输入是Datum为WGS84的经纬度,但在投影时不再把地球当做椭球而当做半径为6378137米的标准球体,以简化计算。
Web墨卡托取得了巨大成功,如今主流的Web地图几乎都是使用的Web墨卡托,如国外的 Google Maps,OpenStreetMap,Bing Map,ArcGIS 和 Heremaps 等,国内的百度地图、高德地图、腾讯地图和天地图等也是基于Web墨卡托(由于国内政策的原因,国内地图会有加密要求,一般有两种情况,一种是在 Web墨卡托的基础上经过国家标准加密的国标02坐标系,熟称“火星坐标系”;另一种是在国标的02坐标系下进一步进行加密,如百度地图的BD09坐标系)。
Web墨卡托投影还切掉了南北85.051129°纬度以上的地区,以保证整个投影是正方形的。Web墨卡托坐标系是非常适合显示数据,但是不适合存储数据的,通常我们使用WGS84 存储数据,使用Web墨卡托显示数据。
WEB GIS中常用的坐标系一般有两种,一种是以经纬度表示的WGS84坐标系(EPSG:4326),另一种为主流WEB地图厂商使用的WEB墨卡托投影(EPSG:3857)
Web墨卡托投影有两个相关的投影标准,经常搞混:
- EPSG4326:Web墨卡托投影后的平面地图,但仍然使用WGS84的经度、纬度表示坐标;
- EPSG3857:Web墨卡托投影后的平面地图,坐标单位为米。
X and Y:
- X goes from 0 (left edge is 180 °W) to 2zoom − 1 (right edge is 180 °E)
- Y goes from 0 (top edge is 85.0511 °N) to 2zoom − 1 (bottom edge is 85.0511 °S) in a Mercator projection
Web墨卡托投影,以整个世界范围,赤道作为标准纬线,本初子午线作为中央经线,两者交点为坐标原点,向东向北为正,向西向南为负。对于 Web Map 开发人员来说,最熟悉的应该是EPSG:4326 (WGS84) and EPSG:3857(Pseudo-Mercator)。
X轴:由于赤道半径为6378137米,则赤道周长为2PIr = 2*20037508.3427892,因此X轴的取值范围:[-20037508.3427892,20037508.3427892]。
Y轴:由墨卡托投影的公式可知,当纬度接近两极,即90°时,y值趋向于无穷。这是那些“懒惰的工程师”就把Y轴的取值范围也限定在[-20037508.342789244,20037508.342789244]之间,搞个正方形。
1.2 经纬度坐标系
有了参考椭球体这样的几何模型后,就可以定义坐标系来进行描述位置,测量距离等操作,使用相同的坐标系,可以保证同样坐标下的位置是相同的,同样的测量得到的结果也是相同的。通常有两种坐标系 地理坐标系(geographic coordinate systems) 和 投影坐标系(projected coordinate systems)。
(1)地理坐标系(Geographic coordinate system)
地理坐标系一般是指由经度、纬度和高度组成的坐标系,能够标示地球上的任何一个位置。
(2)投影坐标系(Projected coordinate systems)
地理坐标系是三维的,我们要在地图或者屏幕上显示就需要转化为二维,这被称为投影(Map projection)。显而易见的是,从三维到二维的转化,必然会导致变形和失真,失真是不可避免的。常用的投影有等矩矩形投影(Platte Carre)和墨卡托投影(Mercator)。
伪墨卡托投影,也被称为球体墨卡托,Web Mercator。它是基于墨卡托投影的,把 WGS84坐标系投影到正方形。我们前面已经知道 WGS84 是基于椭球体的,但是伪墨卡托投影把坐标投影到球体上,这导致两极的失真变大,但是却更容易计算。另外,伪墨卡托投影还切掉了南北85.051129°纬度以上的地区,以保证整个投影是正方形的。因为墨卡托投影等正形性的特点,在不同层级的图层上物体的形状保持不变,一个正方形可以不断被划分为更多更小的正方形以显示更清晰的细节。很明显,伪墨卡托坐标系是非常显示数据,但是不适合存储数据的,通常我们使用WGS84 存储数据,使用伪墨卡托显示数据。
国内主要采用如下三种:
-
WGS84:为一种大地坐标系,也是目前广泛使用的GPS全球卫星定位系统使用的坐标系。
-
GCJ02:又称火星坐标系,是由中国国家测绘局制订的地理信息系统的坐标系统。由WGS84坐标系经加密后的坐标系。
-
BD09:为百度坐标系,在GCJ02坐标系基础上再次加密。其中bd09ll表示百度经纬度坐标,bd09mc表示百度墨卡托米制坐标。
使用OpenStreetMap的坐标为WGS84;使用高德地图、腾讯地图的坐标为GCJ02;使用百度地图的坐标为BD09;谷歌地图和Bing地图的中国部分采用了高德地图的数据,所以坐标为GCJ02。
WGS84的坐标转化为GCJ02的坐标是单向的,即WGS84的坐标能够准确地变换为GCJ02坐标;但GCJ02坐标转换为WGS84时会存在精度损失。
1.3 瓦片定义
瓦片:指将一定范围内的地图按照一定的尺寸和格式,按缩放级别或者比例尺,切成若干行和列的正方形栅格图片,对切片后的正方形栅格图片被形象的称为瓦片(Tile)。
对于经过墨卡托投影为平面的世界地图,在不同的地图分辨率(整个世界地图的像素大小)下,通过切割的方式将世界地图划分为像素为 256 × 256的地图单元,划分成的每一块地图单元称为地图瓦片。
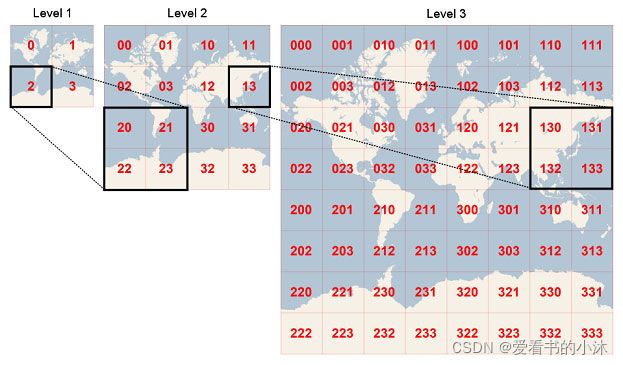
经过Web墨卡托投影后,地图就变为平面的一张地图。为此,我们对这张地图进行等级切分。在最高级(zoom=0),需要的信息最少,只需保留最重要的宏观信息,因此用一张256x256像素的图片表示即可;在下一级(zoom=1),信息量变多,用一张512x512像素的图片表示;以此类推,级别越低的像素越高,下一级的像素是当前级的4倍。这样从最高层级往下到最低层级就形成了一个金字塔坐标体系。
1.4 瓦片编号
- 谷歌XYZ:Z表示缩放层级,Z=zoom;XY的原点在左上角,X从左向右,Y从上向下。
- TMS:开源产品的标准,Z的定义与谷歌相同;XY的原点在左下角,X从左向右,Y从下向上。
- QuadTree:微软Bing地图使用的编码规范,Z的定义与谷歌相同,同一层级的瓦片不用XY两个维度表示,而只用一个整数表示,该整数服从四叉树编码规则
- 百度XYZ:Z从1开始,在最高级就把地图分为四块瓦片;XY的原点在经度为0纬度位0的位置,X从左向右,Y从下向上。
1.5 瓦片和像素
| Level of Detail | Map Width and Height (pixels) | Ground Resolution (meters / pixel) | Map Scale(at 96 dpi) |
|---|---|---|---|
| 1 | 512 | 78,271.5170 | 1 : 295,829,355.45 |
| 2 | 1,024 | 39,135.7585 | 1 : 147,914,677.73 |
| 3 | 2,048 | 19,567.8792 | 1 : 73,957,338.86 |
| 4 | 4,096 | 9,783.9396 | 1 : 36,978,669.43 |
| 5 | 8,192 | 4,891.9698 | 1 : 18,489,334.72 |
| 6 | 16,384 | 2,445.9849 | 1 : 9,244,667.36 |
| 7 | 32,768 | 1,222.9925 | 1 : 4,622,333.68 |
| 8 | 65,536 | 611.4962 | 1 : 2,311,166.84 |
| 9 | 131,072 | 305.7481 | 1 : 1,155,583.42 |
| 10 | 262,144 | 152.8741 | 1 : 577,791.71 |
| 11 | 524,288 | 76.4370 | 1 : 288,895.85 |
| 12 | 1,048,576 | 38.2185 | 1 : 144,447.93 |
| 13 | 2,097,152 | 19.1093 | 1 : 72,223.96 |
| 14 | 4,194,304 | 9.5546 | 1 : 36,111.98 |
| 15 | 8,388,608 | 4.7773 | 1 : 18,055.99 |
| 16 | 16,777,216 | 2.3887 | 1 : 9,028.00 |
| 17 | 33,554,432 | 1.1943 | 1 : 4,514.00 |
| 18 | 67,108,864 | 0.5972 | 1 : 2,257.00 |
| 19 | 134,217,728 | 0.2986 | 1 : 1,128.50 |
| 20 | 268,435,456 | 0.1493 | 1 : 564.25 |
| 21 | 536,870,912 | 0.0746 | 1 : 282.12 |
| 22 | 1,073,741,824 | 0.0373 | 1 : 141.06 |
| 23 | 2,147,483,648 | 0.0187 | 1 : 70.53 |
- Zoom levels
| zoom level | tile coverage | number of tiles | tile size(*) in degrees |
|---|---|---|---|
| 0 | 1 tile | covers whole world | 1 tile 360° x 170.1022° |
| 1 | 2 × 2 tiles | 4 tiles | 180° x 85.0511° |
| 2 | 4 × 4 tiles | 16 tiles | 90° x [variable] |
| n | 2n × 2n tiles | 22n tiles | 360/2n° x [variable] |
| 12 | 4096 x 4096 tiles | 16 777 216 | 0.0879° x [variable] |
| 16 | 232 ≈ 4 295 million tiles | ||
| 17 | 17.2 billion tiles | ||
| 18 | 68.7 billion tiles | ||
| 19 | Maximum zoom for Mapnik layer | 274.9 billion tiles |
1.6 瓦片计算公式
https://wiki.openstreetmap.org/wiki/Slippy_map_tilenames
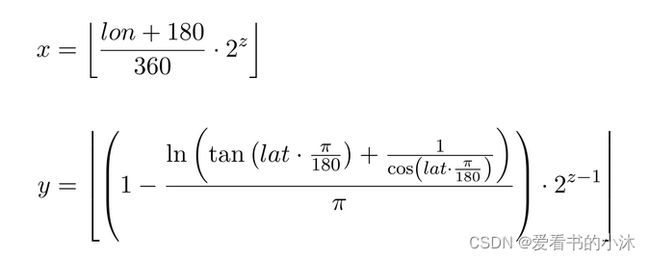

- Lon./lat. to tile numbers:
import math
def deg2num(lat_deg, lon_deg, zoom):
  lat_rad = math.radians(lat_deg)
  n = 2.0 ** zoom
  xtile = int((lon_deg + 180.0) / 360.0 * n)
  ytile = int((1.0 - math.asinh(math.tan(lat_rad)) / math.pi) / 2.0 * n)
  return (xtile, ytile)
- Tile numbers to lon./lat:
import math
def num2deg(xtile, ytile, zoom):
  n = 2.0 ** zoom
  lon_deg = xtile / n * 360.0 - 180.0
  lat_rad = math.atan(math.sinh(math.pi * (1 - 2 * ytile / n)))
  lat_deg = math.degrees(lat_rad)
  return (lat_deg, lon_deg)
我们这里开始测试一下上面的公式和代码,选择北京大学的未名湖为目标,测试如下:
- (1)查询经纬度
地球在线,https://map.jiqrxx.com/jingweidu/
地球在线2,https://www.earthol.com/g/
百度坐标拾取器,http://api.map.baidu.com/lbsapi/getpoint/index.html
- (2)记录目标的经纬度
未名湖的经纬度(纬度,经度):39.99476256945049, 116.30985796451569
-(3)计算瓦片坐标编号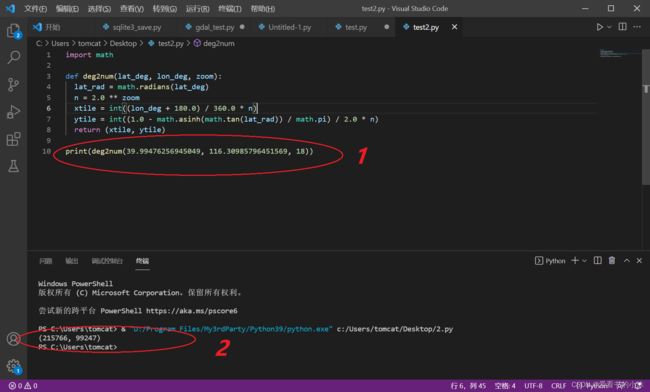
计算结果为:215766, 99247
- (4)构造瓦片查询网页地址
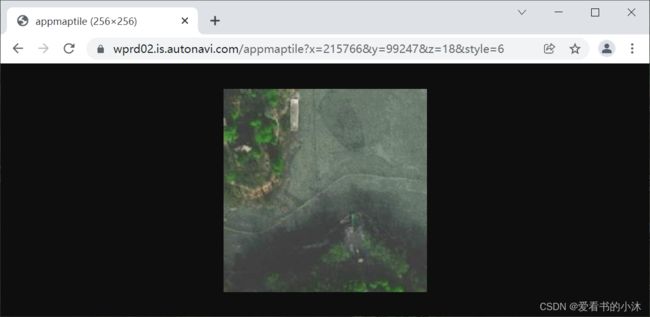
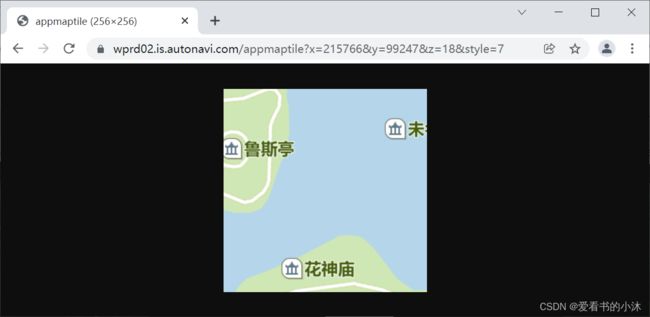
这里使用高德地图的服务接口,构造如下:
http://wprd02.is.autonavi.com/appmaptile?x=215766&y=99247&z=18&style=6
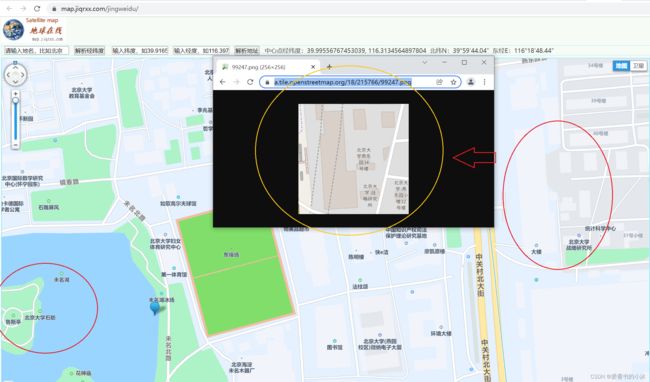
注意:如果使用上面参数构造OpenStreetMap的瓦片网页地址,结果显示发生明显的偏移,如下:
https://a.tile.openstreetmap.org/18/215766/99247.png
1.7 网络地图服务(WMS)
Open Geospatial Consortium (OGC) home page/
https://www.osgeo.cn/ogc-e-learning/wms/slides/presentation.html
http://www.giswiki.org/wiki/Web_Map_Service
网络地图服务(Web Map Service,WMS)利用具有地理空间位置信息的数据制作地图。其中将地图定义为地理数据可视的表现。能够根据用户的请求返回相应的地图(包括PNG,GIF,JPEG等栅格形式或者是SVG和WEB CGM等矢量形式)。WMS支持网络协议HTTP,所支持的操作是由URL定义的。
1.8 切片地图服务(TMS)
https://wiki.osgeo.org/wiki/Tile_Map_Service_Specification
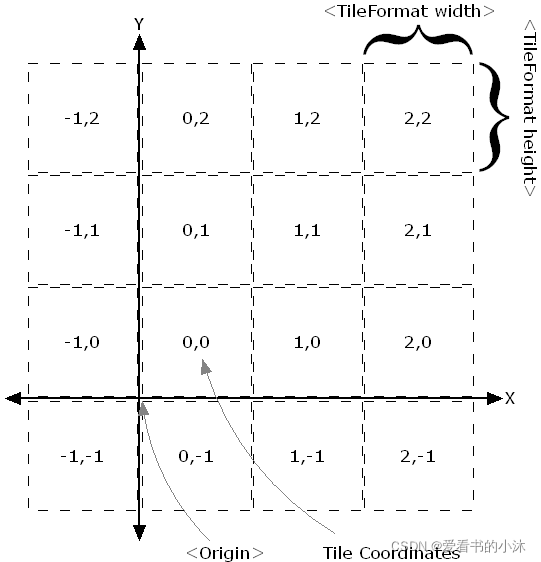
TMS是纯Restful;而WMTS可以有KVP、SOAP和Restful三种。
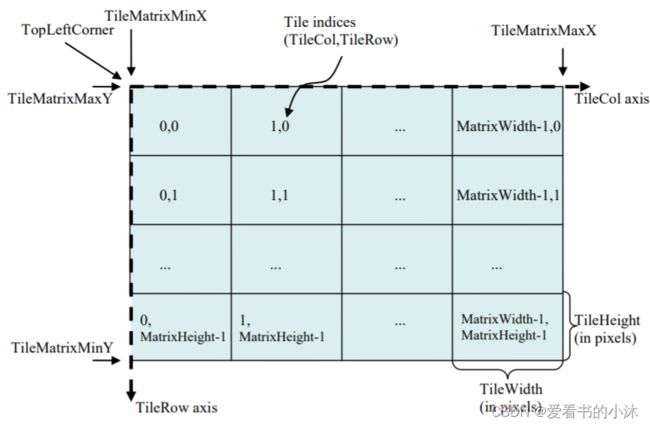
TMS瓦片是正方形的,而WMTS是矩形的(正方形是特殊的矩形)。
在纵轴方向上方向相反,TMS瓦片以左下角为原点,WMTS瓦片以左上角为原点。
1.9 切片地图web服务(WMTS)
https://www.ogc.org/standards/wmts
1.10 比例尺
比例尺,通常以比率(如 1:10000 )来表示,表示图上距离与实地距离之比。例如 1:10000 表示图上 1cm 代表实际距离 10000cm,即100米。
由于比例尺起源较早,通常用(纸质)图上的距离衡量实际距离;而分辨率则通常用设备屏幕上的距离来衡量实际距离。而同一个地图视图,尺度是唯一的,比例尺和分辨率只不过是两种表示方法,因此它们是一一对应的。
但是影像图都是通过分辨率来描述精度。在GIS中所提到的 分辨率,也称地面分辨率(Ground Resolution)或空间分辨率(Spatial Resolution),表示一个像素(pixel)代表的地面实际距离。
比例尺与分辨率之间的换算公式如下:
S c a l e = 1 : ( R e s o l u t i o n ∗ P P I 0.0254 ) Scale= 1:(Resolution*\dfrac{PPI}{0.0254}) Scale=1:(Resolution∗0.0254PPI)
Scale:地图比例尺;
Resolution:地图分辨率;
PPI:每英寸的像素点数。默认使用屏幕分辨率为96。
1英寸=96像素(一般的屏幕比例尺)
1英寸(inch)=25.4mm
1米=1000/25.4=39.37英寸
2、地图瓦片数据源
相关内容请查看本人的另一篇博客文章:
https://blog.csdn.net/hhy321/article/details/123490804
3、代码实现
#***********************************************************************
#   Purpose:   python下载和拼接地图瓦片(高德和google地图)
#   Author:    爱看书的小沐
#   Date:      2022-03-04
#   Languages: Python
#   Platform:  Python 3.9.7 win64
# ***********************************************************************
# -*-coding:utf-8 -*-

import os, sys
import math
import urllib.request
import PIL.Image as Image
from PIL import ImageDraw, ImageFont

import urllib
import time
import random
import datetime

def downloadImage(img_url, fname, mylog):
    try:
        urllib.request.urlretrieve(img_url,filename=fname)
    except IOError as e:
        print("--", fname, "->", e)
        print(img_url, file=mylog)
    except Exception as e:
        print("--", fname, "->", e)
        print(img_url, file=mylog)

def downloadImage2(img_url, fname, mylog):
    user_agent = 'Mozilla/5.0 (Macintosh; U; Intel Mac OS X 10_6_8; de-at) AppleWebKit/533.21.1 (KHTML, like Gecko) Version/5.0.5 Safari/533.21.1'
    headers = { 'User-Agent' : user_agent }
    try:
        req = urllib.request.Request(img_url, headers=headers)
        response = urllib.request.urlopen(req)
        bytes = response.read()
    except Exception as e:
        print("--", fname, "->", e)
        print(img_url, file=mylog)
        sys.exit(1)

    if bytes.startswith(b""):
        print("-- forbidden", fname)
        print(img_url, file=mylog)
        sys.exit(1)

    print("-- saving", fname)

    f = open(fname,'wb')
    f.write(bytes)
    f.close()

    time.sleep(1 + random.random())

def num2deg(xtile, ytile, zoom):
    n = 2.0 ** zoom
    lon_deg = xtile / n * 360.0 - 180.0
    lat_rad = math.atan(math.sinh(math.pi * (1 - 2 * ytile / n)))
    lat_deg = math.degrees(lat_rad)
    return (lat_deg, lon_deg)

def getImageUrl(x, y, zoom):
    #高德瓦片,wprd03想必是和谷歌一样,有多个服务器提供服务。测试下来可以取到01 到 04。
    img_url = 'https://wprd01.is.autonavi.com/appmaptile?x={x}&y={y}&z={z}&style=6'.format(x=x, y=y, z=zoom)
    #img_url = 'https://wprd01.is.autonavi.com/appmaptile?x={x}&y={y}&z={z}&lang=zh_cn&size=1&scl=1&style=7<ype=0'.format(x=x, y=y, z=zoom)
    return img_url

def getAndCheckImageFilePath(file_path, x, y, zoom):
    path = file_path + "/" +  str(zoom) + "/" + str(x)
    if not os.path.exists(path):
        os.makedirs(path)
    return getImageFilePath(file_path, x, y, zoom)

def getImageFilePath(file_path, x, y, zoom):
    return file_path + "/" +  str(zoom) + "/" + str(x) + '/'+ str(y)+'.png'

#################################################################
# 图片拼接
#################################################################

def mergeAllImageToOne(file_path, zoom, params):
    xmin = params[0]
    ymin = params[1]
    xmax = xmin + params[2]
    ymax = ymin + params[3]
    mw = 256
    toImage = Image.new('RGB', (256*(xmax-xmin), 256*(ymax-ymin)) )

    for x in range(xmin, xmax):
        for y in range(ymin, ymax):

            fname = getImageFilePath(file_path, x, y, zoom)
            fromImage = Image.open(fname)
            fromImage = fromImage.convert('RGB')
            draw = ImageDraw.Draw(fromImage)

            # 添加每个瓦片的文字信息
            fontSize = 18
            setFont = ImageFont.truetype('C:/windows/fonts/arial.ttf', fontSize)
            fillColor = "#ffff00"
            pos = num2deg(x, y, zoom)
            text = 'Tile: ' + str(x)+ "," + str(y)+ "," + str(zoom)
            text2 = 'Lat: %.6f'%pos[0]
            text3 = 'Lon: %.6f'%pos[1]
            draw.text((1,1), text,font=setFont,fill=fillColor)
            draw.text((1,1+fontSize), text2,font=setFont,fill=fillColor)
            draw.text((1,1+2*fontSize), text3,font=setFont,fill=fillColor)

            # 添加每个瓦片的边框线条
            draw.rectangle([0, 0, mw-1, mw-1], fill=None, outline='red', width=1)

            # 将每个瓦片的小图绘制到大图里面。
            toImage.paste(fromImage, ((x-xmin) * mw, (y-ymin) * mw))

    toImage.save(file_path + '/' + str(zoom) +'/preview.png' )
    toImage.close()

#################################################################
# 图片拼接
#################################################################

def downloadMapAllImage(file_path, zoom, params):
    xmin = params[0]
    ymin = params[1]
    xmax = xmin + params[2]
    ymax = ymin + params[3]

    if not os.path.exists(file_path):
        os.makedirs(file_path)
    mylog = open(file_path + '/err.log', mode = 'a',encoding='utf-8')

    for x in range(xmin, xmax):
        for y in range(ymin, ymax):

            img_url = getImageUrl(x, y, zoom)
            print(img_url)

            img_savepath = getAndCheckImageFilePath(file_path, x, y, zoom)
            print(img_savepath)

            if not os.path.exists(img_savepath):
                downloadImage(img_url, img_savepath, mylog)
                #downloadImage2(img_url, img_savepath, mylog)

    mylog.close()

#################################################################

if __name__ == '__main__':
    starttime = datetime.datetime.now()
    file_path='d:/maps'

    # (1) 全球地图
    zoom = 4
    params = [0, 0, pow(2, zoom), pow(2, zoom)]

    # (2) 中国地图
    # zoom = 9
    # params = [354, 165, 106, 91]

    # (3) 局部地图
    # zoom = 18
    # params = [215768, 99253, 4, 4]

    downloadMapAllImage(file_path, zoom, params)
    mergeAllImageToOne(file_path, zoom, params)

    endtime = datetime.datetime.now()
    print("ok", (endtime - starttime).seconds)
#***********************************************************************
#   Purpose:   python根据经纬度,计算对应的瓦片坐标
#   Author:    爱看书的小沐
#   Date:      2022-03-05
#   Languages: Python
#   Platform:  Python 3.9.7 win64
# ***********************************************************************
# -*-coding:utf-8 -*-
import math

def deg2num(lat_deg, lon_deg, zoom):
  lat_rad = math.radians(lat_deg)
  n = 2.0 ** zoom
  xtile = int((lon_deg + 180.0) / 360.0 * n)
  ytile = int((1.0 - math.asinh(math.tan(lat_rad)) / math.pi) / 2.0 * n)
  return (xtile, ytile)

def deg2url(lat_deg, lon_deg, zoom):
  lat_rad = math.radians(lat_deg)
  n = 2.0 ** zoom
  xtile = int((lon_deg + 180.0) / 360.0 * n)
  ytile = int((1.0 - math.asinh(math.tan(lat_rad)) / math.pi) / 2.0 * n)
  return 'https://wprd01.is.autonavi.com/appmaptile?x={x}&y={y}&z={z}&lang=zh_cn&size=1&scl=1&style=7<ype=0'.format(x=xtile, y=ytile, z=zoom)

def deg2numrange(lat_deg1, lon_deg1, lat_deg2, lon_deg2, zoom):
  tile1 = deg2num(lat_deg1, lon_deg1, zoom)
  tile2 = deg2num(lat_deg2, lon_deg2, zoom)
  tile1new = min(tile1[0], tile2[0]), min(tile1[1], tile2[1])
  tile2new = max(tile1[0], tile2[0]), max(tile1[1], tile2[1])
  return [tile1new[0], tile1new[1], tile2new[0] - tile1new[0], tile2new[1] - tile1new[1]]
随机取一个位置的经纬度,计算它的瓦片坐标,同时构造瓦片网页地址。
# -*-coding:utf-8 -*-
import math

# 输出瓦片坐标
print(deg2num(39.98836718933446, 116.31269474242018, 18))
# 输出瓦片网址
print(deg2url(39.90854390955025, 116.43579204294966, 18))

### 计算结果:
# (215768, 99253)
# https://wprd01.is.autonavi.com/appmaptile?x=215857&y=99329&z=18&lang=zh_cn&size=1&scl=1&style=7<ype=0
4、运行结果
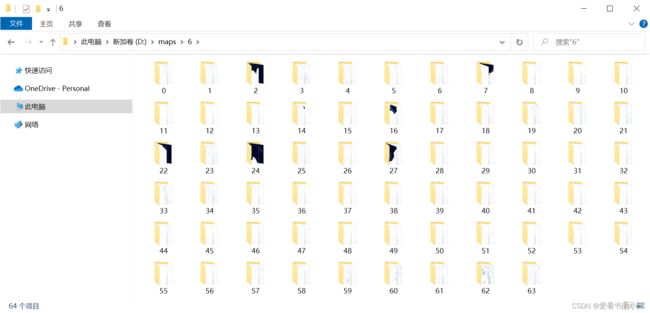
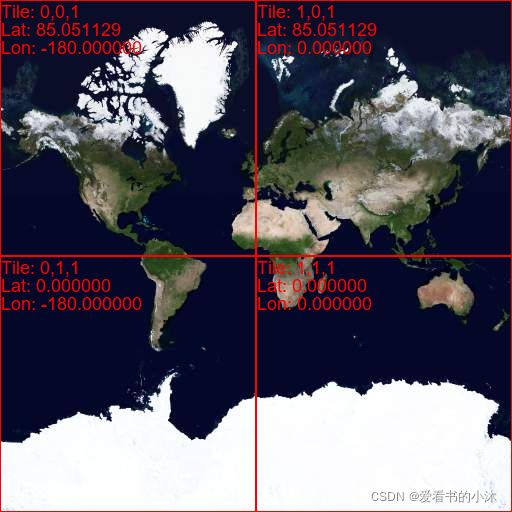
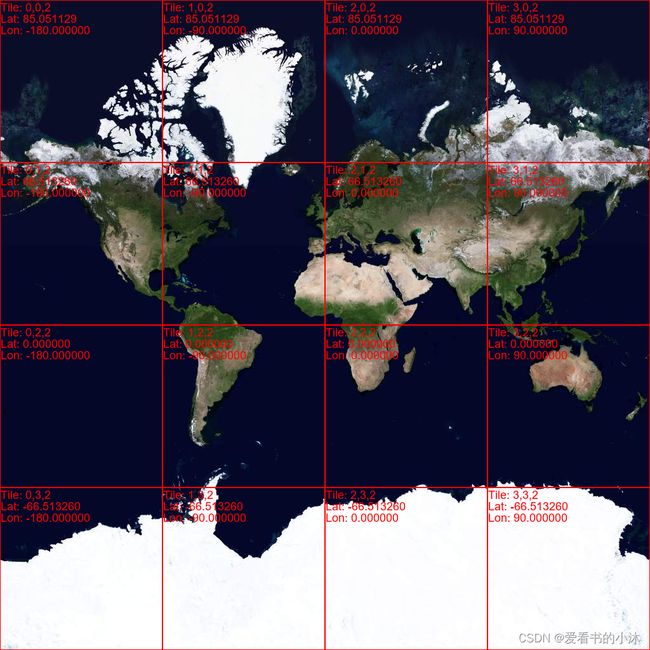
4.1 输出全球图
// 地图瓦片坐标相关参数设置
zoom = 6
左上角第一行文字:列序号x,行序号y,级别zoom
左上角第二行文字:纬度
左上角第三行文字:经度
4.2 输出中国图
将中国框选,取对角线的两个点的经纬度,计算它的瓦片坐标,同时构造瓦片网页地址。
# 输出两个经纬度之间的瓦片坐标
zoom = 5
params = deg2numrange(55.59490258792558, 73.125, -3.3087064670254187, 135.966796875, zoom )
print(params) # [22, 10, 6, 6]
高德矢量图:
https://wprd01.is.autonavi.com/appmaptile?x={x}&y={y}&z={z}&lang=zh_cn&size=1&scl=1&style=7<ype=0
https://wprd01.is.autonavi.com/appmaptile?x={x}&y={y}&z={z}&style=6
ArcGIS矢量图:
https://map.geoq.cn/ArcGIS/rest/services/ChinaOnlineCommunity/MapServer/tile//{z}/{y}/{x}
ArcGIS卫星图:
https://services.arcgisonline.com/arcgis/rest/services/World_Imagery/MapServer/tile/{z}/{y}/{x}
4.3 输出局部图
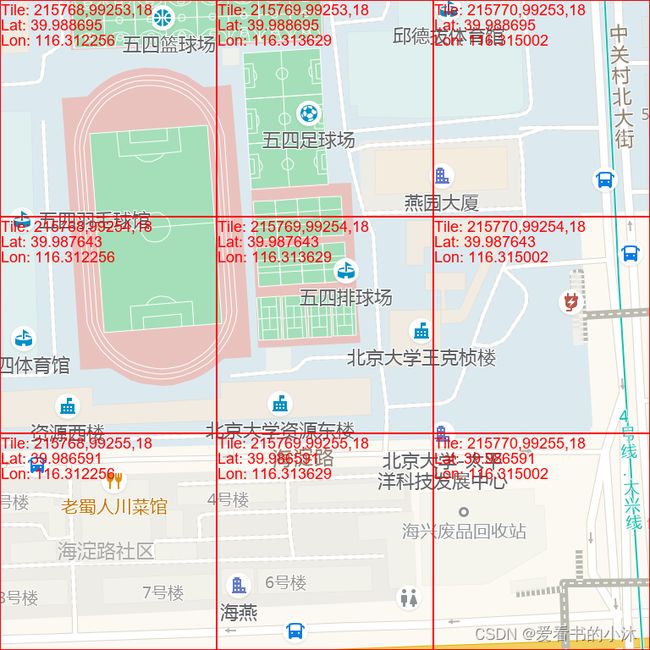
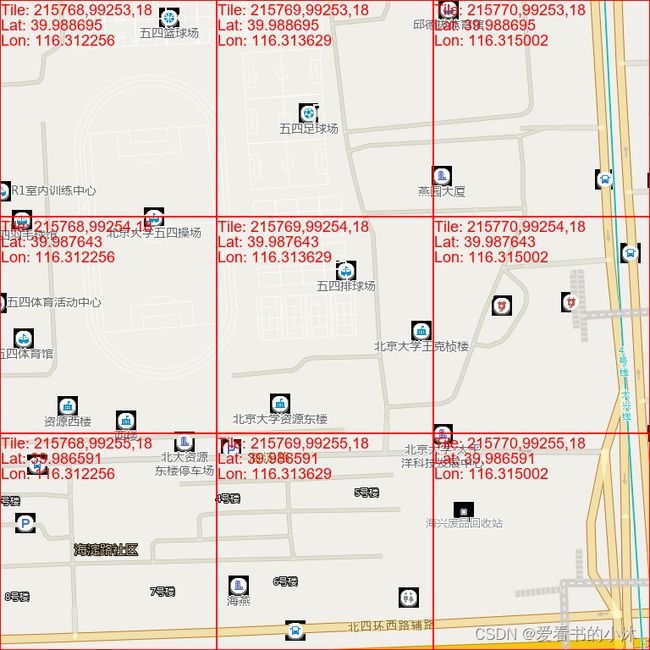
设置局部地图(以北京大学的五四体育场附近区域为例)的瓦片坐标参数如下,进行批量操作。
// 地图瓦片坐标相关参数设置
# 输出两个经纬度之间的瓦片坐标
zoom = 18
params = deg2numrange(39.98839635086475, 116.31254017353058, 39.98523562551436, 116.31646156311035, zoom )
print(params)  # [215768, 99253, 3, 3]
// 高德卫星影像图
https://wprd01.is.autonavi.com/appmaptile?x={x}&y={y}&z={z}&style=6
// 高德交通路网简图
https://wprd01.is.autonavi.com/appmaptile?x={x}&y={y}&z={z}&lang=zh_cn&size=1&scl=1&style=7<ype=0
// 高德交通路网详图
https://wprd01.is.autonavi.com/appmaptile?x={x}&y={y}&z={z}&lang=zh_cn&size=1&scl=1&style=8<ype=0
结语
如果您觉得该方法或代码有一点点用处,可以给作者点个赞,或打赏杯咖啡;╮( ̄▽ ̄)╭
如果您感觉方法或代码不咋地//(ㄒoㄒ)//,就在评论处留言,作者继续改进;o_O???
如果您需要相关功能的代码定制化开发,可以留言私信作者;(✿◡‿◡)
感谢各位童鞋们的支持!( ´ ▽´ )ノ ( ´ ▽´)っ!!!
![]()
