统计学习导论-基于R应用学习笔记
目录
误差
假设检验
F-检验
分类classification
线性判别分析(LDA)
Threshold 分类阀值
resampling 重采样
留一法交叉验证(LOOCV)
The Bootstrap
模型精度
Lasso 套索
多项式回归
Regression Splines回归样条
Tree树
Classification trees分类树
提升tree
OOB袋外误差
Random forest 随机森林
SVM支持向量机
Support Vector Machines 狭义支持向量机
无监督学习
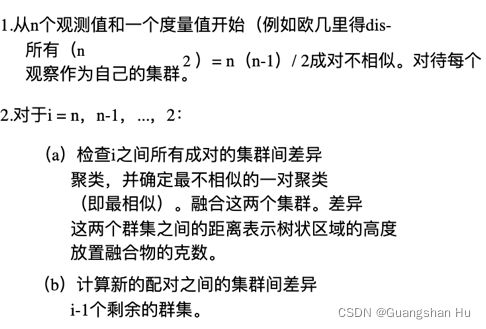
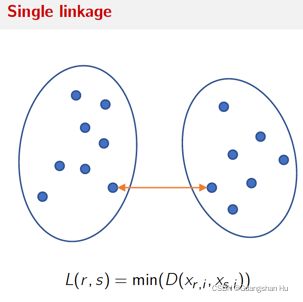
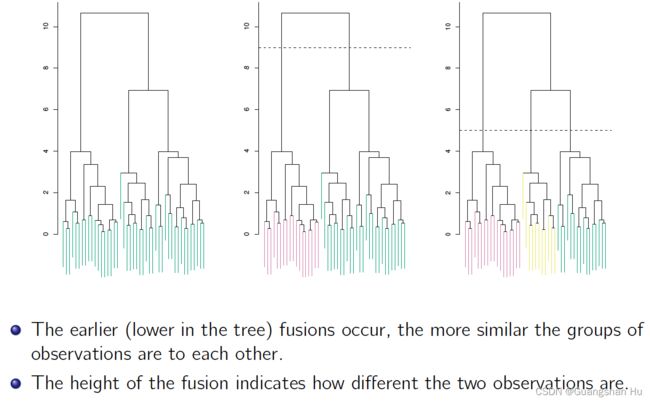
分层聚类
误差
Statistical learning: A set of tools for understanding data一组工具对于理解数据

可约误差:我们可以改善的准确性通过使用更好的学习技术来估计
不可约错误:Y的函数和错误无法预测使用X无论如何我们估计f,我们不能减少错误
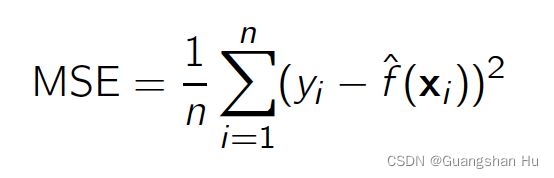
The most common approach to fitting the model is referred to as (ordinary)
least squares最常见的方法来拟合模型被称为最小二乘(普通)
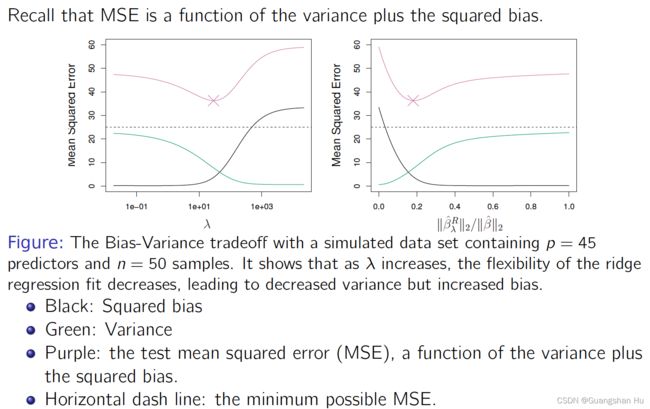
mean squared error (MSE) 均方误差
Variance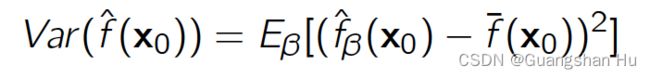
Bias 
Bayes error rate贝叶斯错误率

假设检验
coefficient 系数
intercept 截距
Covariance and correlation between variables with cov() and cor()
cov()与cor()变量间的协方差与相关关系
residual sum of squares (RSS)残次平方h和 residual 残差: ei = yi - ^yi


summary() --> coefficients 系数

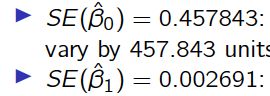
SE(![]() ) = 0:457843: in the absence of any advertising, the average sales can
) = 0:457843: in the absence of any advertising, the average sales can
vary by 457.843 units.
SE( ![]() ) = 0:002691: for each $1,000 increase in television advertising, the
) = 0:002691: for each $1,000 increase in television advertising, the
average increase in sales can vary by 2.691 units.
SE(![]() )= 0.457843:在不存在任何的广告的平均销售可以
)= 0.457843:在不存在任何的广告的平均销售可以
相差457.843个单位。
SE(![]() )= 0.002691:在电视广告每$ 1,000的增加,
)= 0.002691:在电视广告每$ 1,000的增加,
平均销售增长量可能相差2.691个单位


假设检验hypothesis tests


Large t value indicates the null hypothesis could be rejected.
大T值表示零假设可能被拒绝
Small t value indicates rejecting the null hypothesis could cause a type-I error.
小T值指示拒绝零假设可能导致I型误差
Small p-value (Pr(> jtj) < _ = 0:001): reject the null hypothesis
小的p值(PR(> | T |)
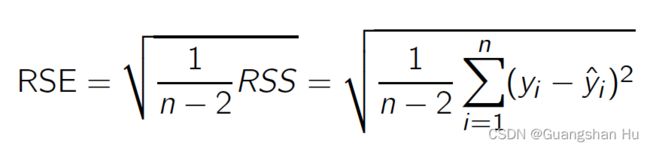
A measure of the quality of a linear regression fit, or a measure of the lack of fit of the model
对线性回归拟合质量的衡量,或对模型拟合不足的衡量

R2表示模型拟合实际数据越好。
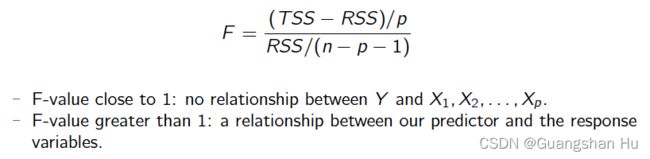
F-检验


n较大:较小的f值提供了反对H0的有力证据。
n小:需要较大的f值。

各变量之间的关联程度:
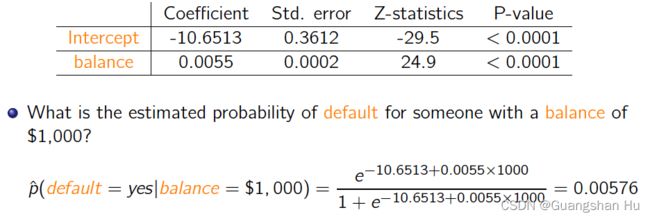
计算概率是否逾期概率,balance有$1000:
Some predictors are not quantitative but are qualitative, taking a discrete set of values.
一些预测变量不是定量的而是定性的,需要离散的一组值
These are also called categorical predictors or factor variables. 分类预测变量或因子变量
分类classification
定性特征无法用线性回归预测,于是用分类,P在0-1之间
Logitic regression逻辑回归,给定变量X去预测Y(建立Y的分布模型)
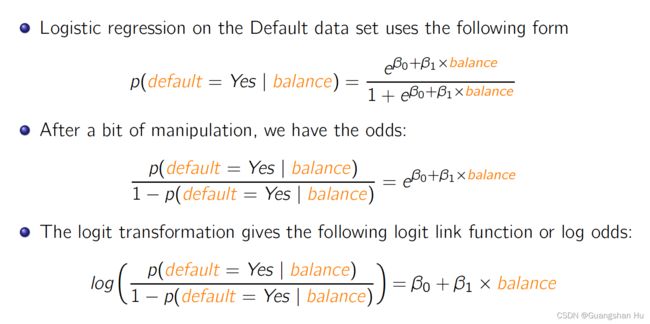
同时取对数后,又成为一个线性回归,Y是对数比

当balance为1000时,预期概率为0.00576
线性判别分析(LDA)
Linear Discriminate Analysis (LDA)
- Gaussian distributions for different classes share the same covariance structure.
Quadratic Discriminant Analysis (QDA):
- No such a constraint on the covariance structure.
线性判别分析(LDA)
−不同类别的高斯分布共享相同的协方差结构。
二次判别分析(QDA):
−对协方差结构没有这样的约束
prior probability (unconditioned probability) 先验概率(无条件概率)
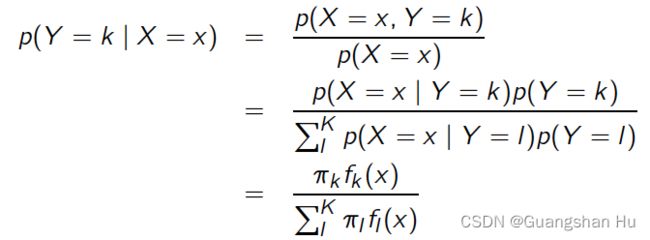
fk (x) = p(X = x j Y = k) is the density for X in class k.
πk = p(Y = k) is the prior probability for class k.
f k (x)= p(X = x | Y = k)是类别k中X的密度。
π ķ = P(Y = k)是用于类k的先验概率


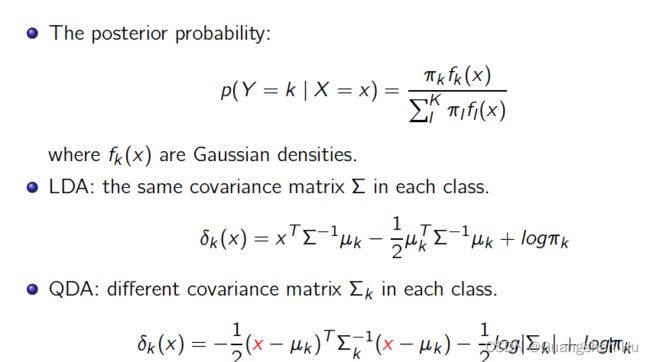
assigning x to the class with the largest discriminant score给判别分数最大的类赋x
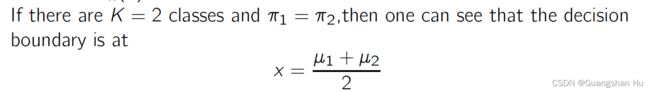
如果K=2, 贝叶斯分类边界在中点
多元预测变量时:
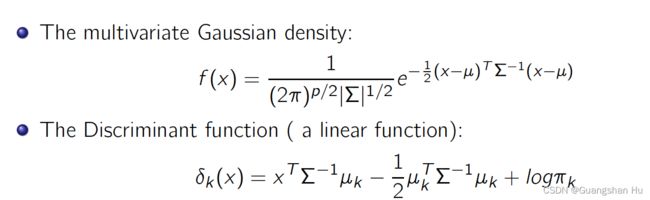
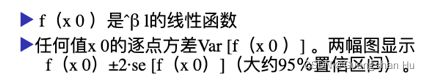
一维情况相似。对一个新的观测X=x , LDA 将这些参数估计值代人,并将观测分入使得ðk(x) 最大的一类中。注意到15, (叫是一个关于后的线性函数,也就是说LDA 决策规则只依赖
于z 与其他元索的线性组合。这也是线性判别分析中线性( line)

Threshold 分类阀值


When the classes are well-separated, the parameter estimates for the logistic regression model are surprisingly unstable. Linear discriminant analysis does not suffer from this problem.
If n is small and the distribution of the predictors X is approximately normal in each of the classes, the linear discriminant model is again more stable than the logistic regression model.
Linear discriminant analysis is popular when we have more than two response classes
当类被很好地分离时,logistic回归模型的参数估计惊人地不稳定。线性判别分析没有这个问题。
如果n很小,并且预测因子X在每个类中的分布近似正态,那么线性判别模型再次比逻辑回归模型更稳定。
当我们有两个以上的响应类时,线性判别分析很流行
 Black dotted:
LDA decision boundary
Purple dashed:
Bayes decision boundary
Green solid:
QDA decision boundar
Left: variances of the classes are equal (LDA is better fit)
Right: variances of the classes are not equal (QDA is better fit)
Logistic regression uses the conditional likelihood based on p(Y jX), known
as discriminative learning
LDA uses the full likelihood based on p(X;Y ) (known as generative learning).
逻辑回归使用条件可能基于p (Y jX),称为有识别
LDA使用完整的可能性基于p (X, Y)(称为生成学习)。
Logistic regression is very popular for classification, especially when K = 2. LDA is useful when n is small, or the classes are well separated, and Gaussian assumptions are reasonable. Also when K > 2.
Logistic回归是非常流行的分类方法,特别是当K = 2时。LDA非常有用当n很小,或者类分离,高斯假设是合理的。
Hit: if the decision boundary is
-Linea线性r: LDA and Logistic outperforms
- Moderately Non-linear中等非线性: QDA outperforms.
- More complicated更复杂: KNN is superior.
resampling 重采样
Two the most commonly used resampling methods:
Cross Validation
− Be used to estimate the test error associated with a given statistical learning method
用于估计与给定的统计学习方法相关的测试误差
− in order to evaluate its performance, or to select the appropriate level of flexibility
为了评估其表现,或选择适当的灵活性水平
… Bootstrap
− To provide a measure of accuracy of a parameter estimate or of a given statistical learning method
-提供参数估计或给定的统计学习方法的准确性的度量
The process of evaluating the performance of a model is known as model assessment
The process of selecting the proper level of flexibility for a model is known as model selection
缺点:
-the validation estimate of the test error rate can be highly variable, depending on precisely which observations are included in the training set and which observations are included in the validation set验证估计的测试错误率可以高度变量,根据精确的观测都包含在训练集和观测结果都包含在验证集
-In the validation approach, only a subset of the observations (those that are included in the training set rather than in the validation set) used to fit the model
− Since statistical methods tend to perform worse when trained on fewer observations,
− This suggests that the validation set error rate may tend to overestimate the test error rate for the model fit on the entire data set.
验证的方法,只有一个子集的观察(包括那些在训练集,而不是验证集)用于适应模型
−由于统计方法往往上训练时表现更糟更少的观测
-这表明验证集的错误率可能倾向于高估测试错误率为模型适合对整个数据集。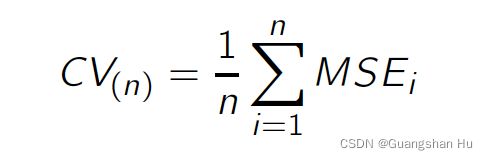
留一法交叉验证(LOOCV)
It has far less bias低偏差
Performing LOOCV multiple times will always yield the same results
多次执行LOOCV将始终产生相同的结果
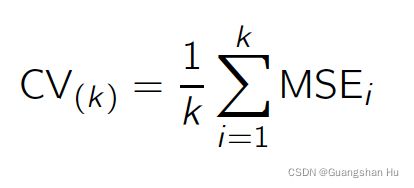 (k-fold法)
The test error estimate resulting from LOOCV tends to have higher variance than does the test error estimate resulting from k-fold CV
由LOOCV产生的测试误差估计比由k倍CV产生的测试误差估计具有更高的方差
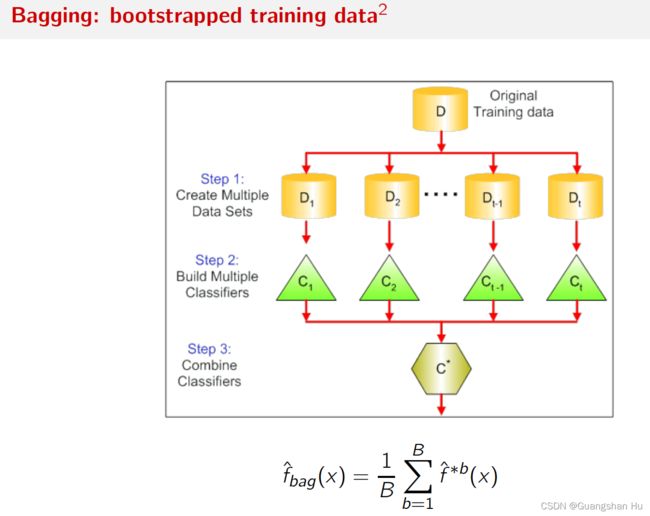
The Bootstrap
自助法通过反复从原始数据集(original data set) 中抽取观测得到数据集。

量化a的准确度
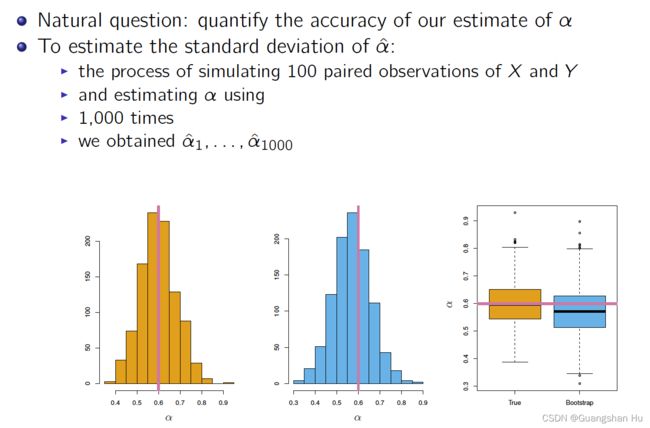
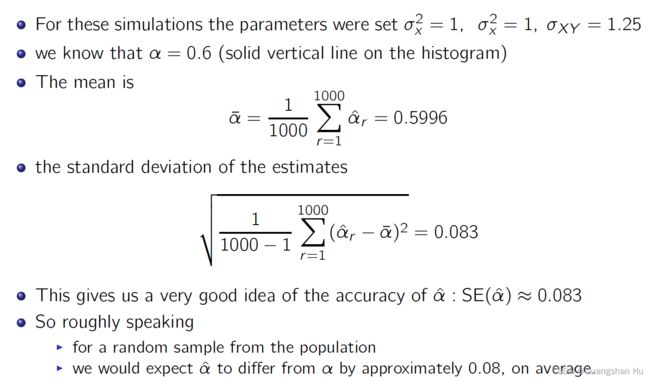
for real data we cannot generate new samples from the original population
the bootstrap approach allows us to use a computer to emulate the process of obtaining new sample sets
对于真实数据,我们不能从原始总体中生成新的样本
bootstrap方法允许我们使用计算机来模拟获取新样本集的过程
Rather than repeatedly obtaining independent data sets from the population, we instead obtain distinct data sets by repeatedly sampling observations from the original data set
而不是反复从人口获得独立的数据集,我们通过多次采样观测获得不同的数据集从原始数据集


模型精度

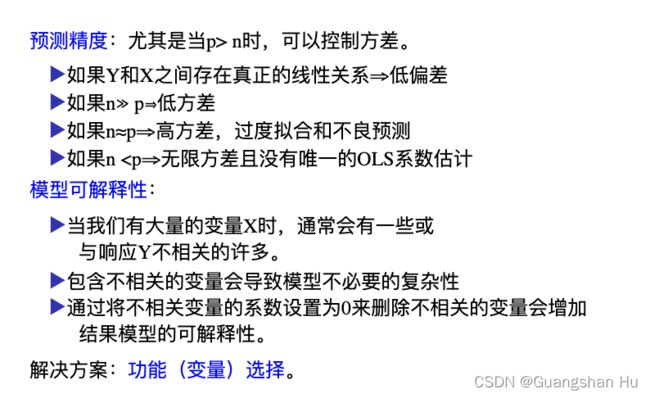
Subsect Selection:
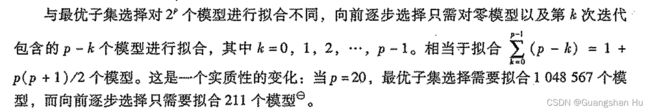
Identifying a subset of all p predictors X that we believe to be related to the response Y , and then fitting the model least squares on the reduced set of variables. 该方法从p 个预测变激中挑选出与自由应变最相关的变最形成子集,再对缩减的变盘集合使用最小二乘方法。

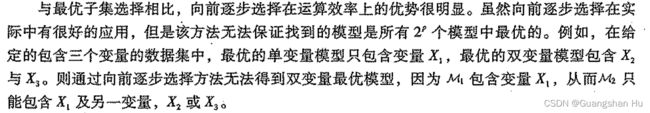
两者的区别:
the best possible one-variable model contains X1,the best possible two-variable model instead contains X2 and X3


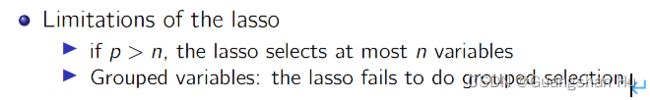
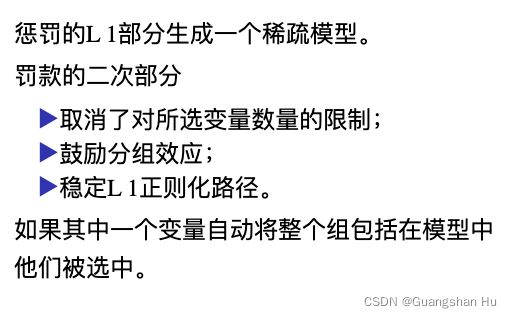
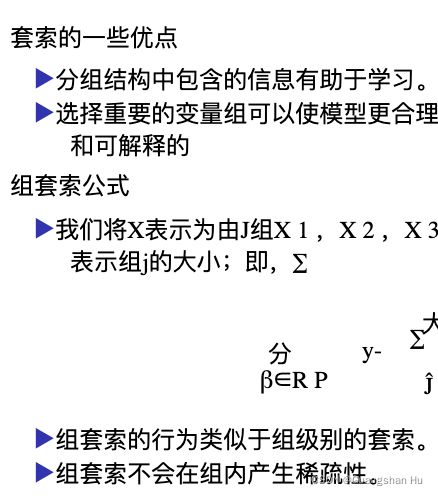
Lasso 套索
![]()
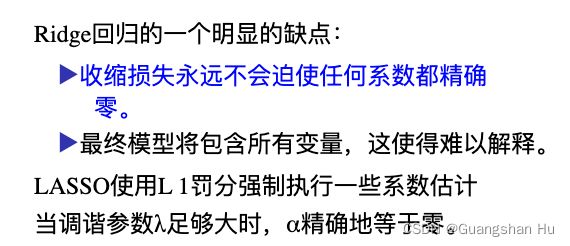
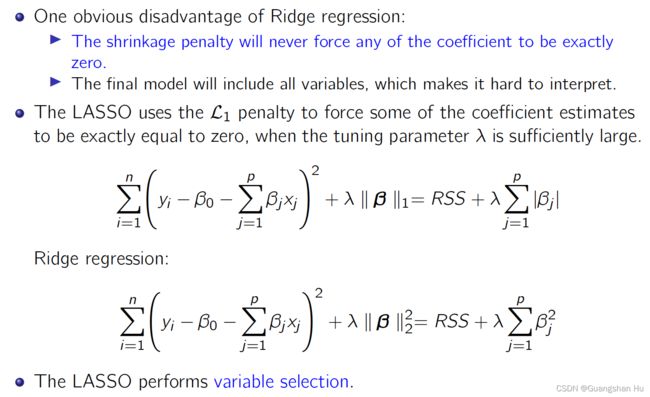


Neither ridge regression nor the lasso will universally
Dominate the other. ridge回归和套索都不会普遍地支配对方。


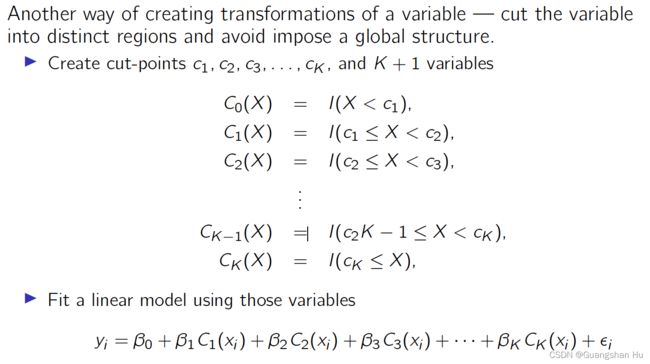
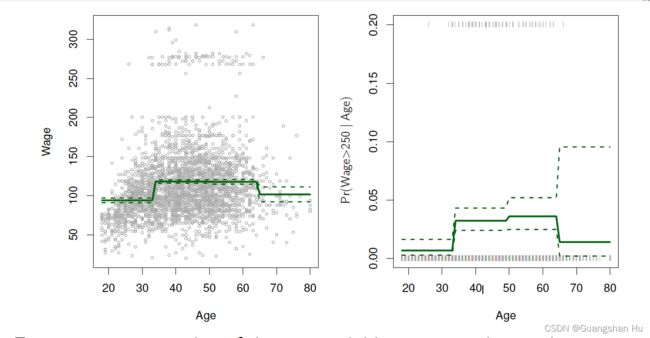
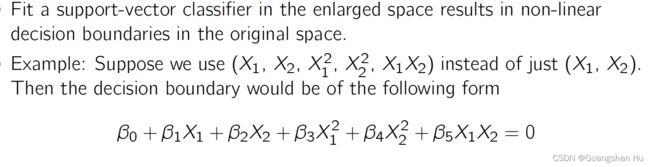
多项式回归

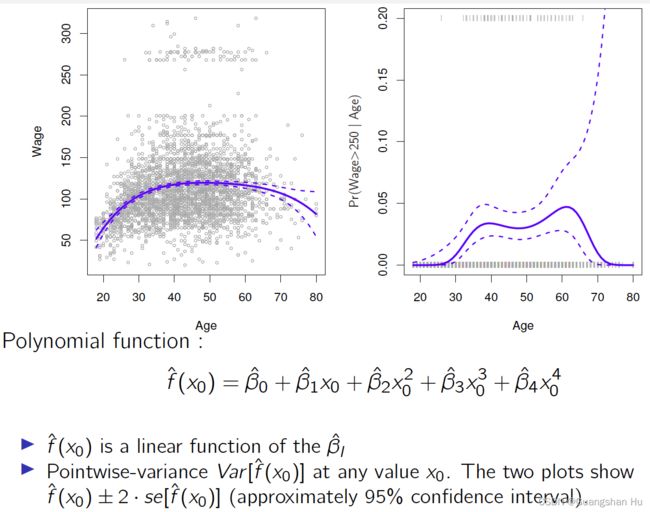


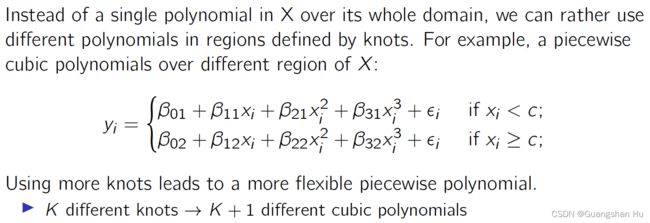
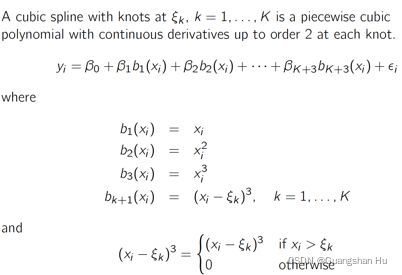
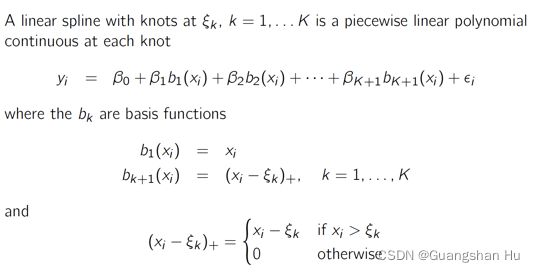
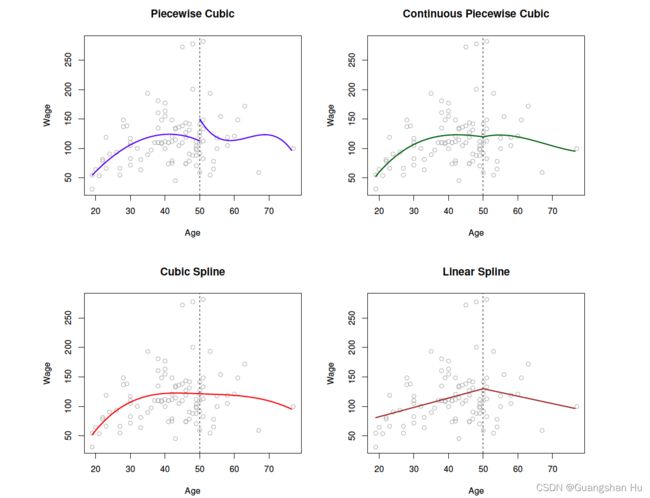
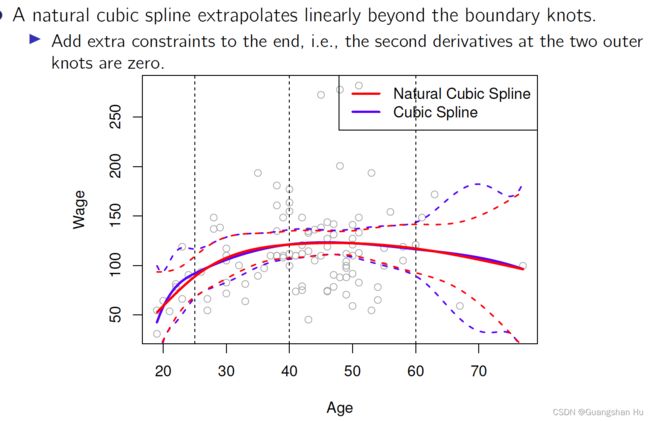
Regression Splines回归样条


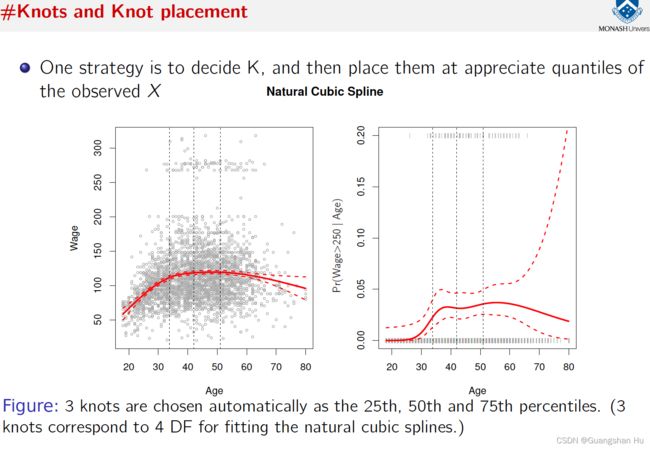


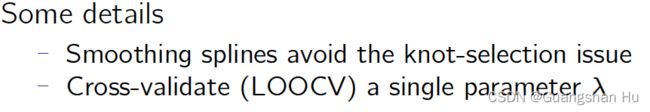
 平滑样条线Smoothspline
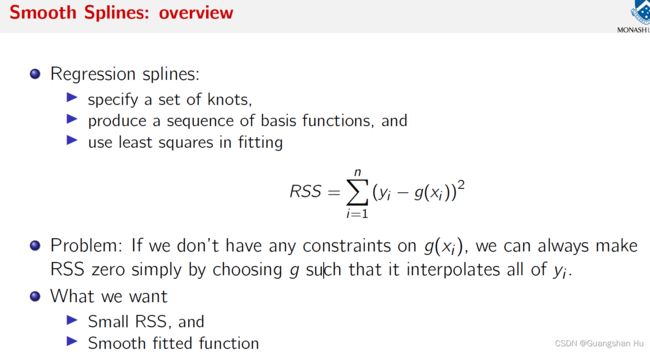


Local Regression 局部回归

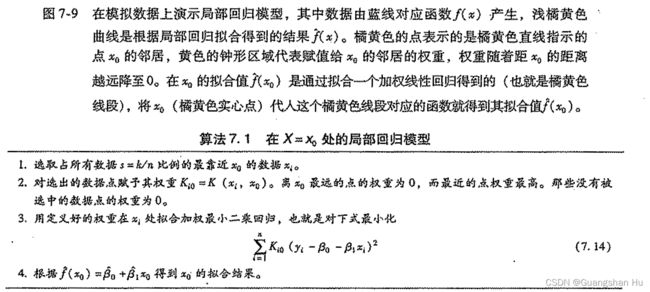


Smaller value of s, the more local and wiggly will be our fit.
A very large value of s will lead to a global and smooth fit.
Generalised Additive Models: regression广义可加模型


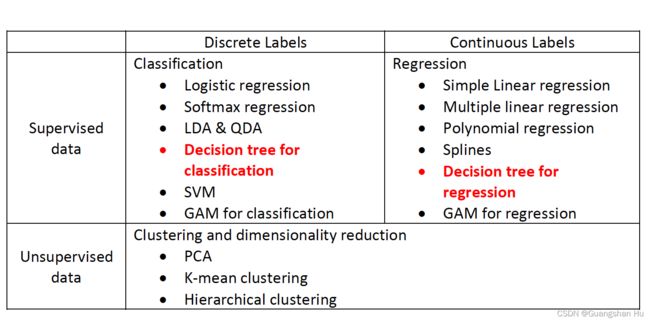
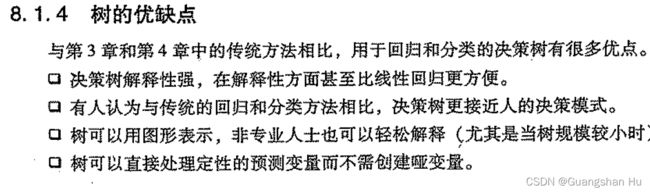
Tree树


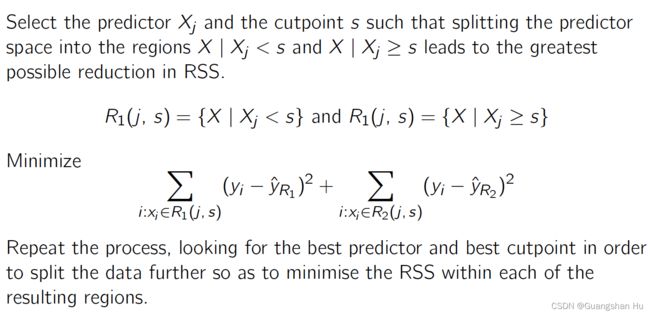
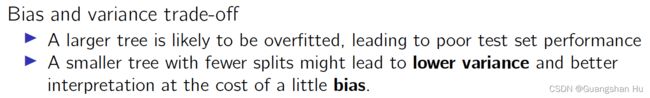


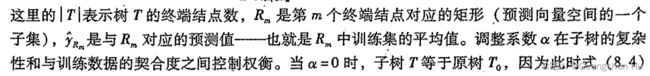

Tree Pruning:剪枝的目的是选出使测试集预测误差最小的子树。子树的测试误差可以通过交叉验证或验证集来估计。但由于可能的子树数最极其庞大,对每一棵子树都用交叉验证来估计误差太过集杂。因此需要从所有可能的子树中选出一小部分再进行考虑。
Classification trees分类树
Classification trees are used to predict qualitative rather than quantitative variables分类树被用于预测定性变量而非定量变量


提升tree
回归树预测响应值求平均
分类树采取多数投票(majority vote)

OOB袋外误差


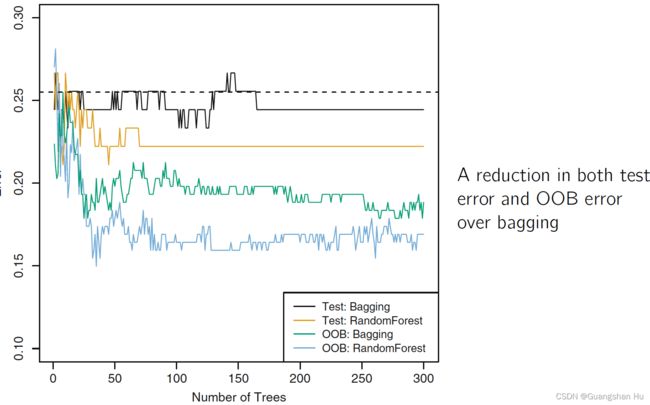
Random forest 随机森林
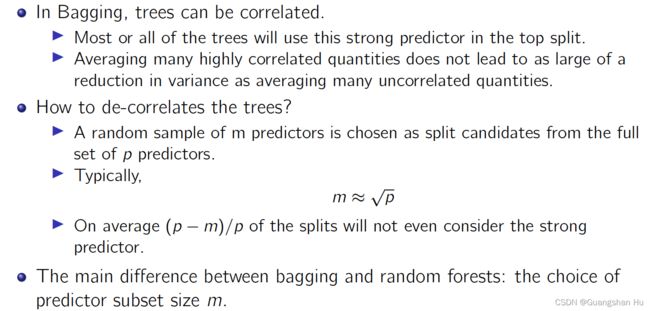

随机森林在P个预测变量中,随机选择m个,避免了每个tree都用最强的预测变量为top node
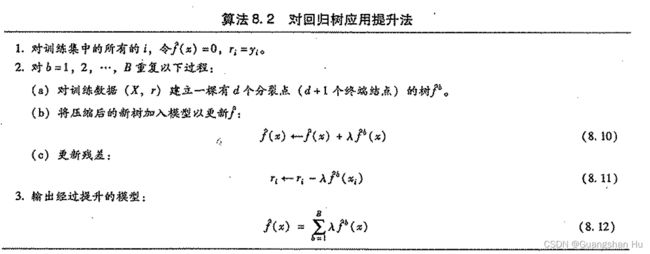
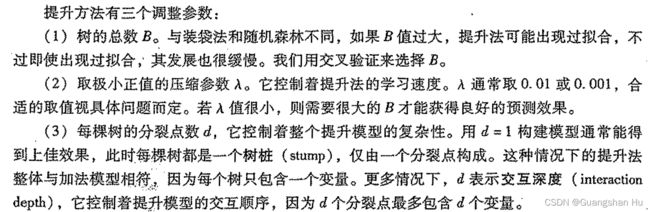
Boosting提升法

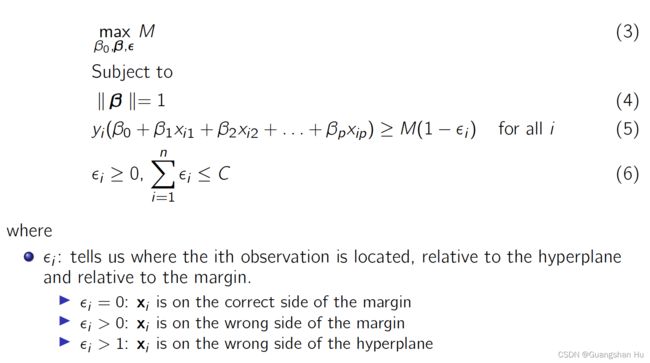
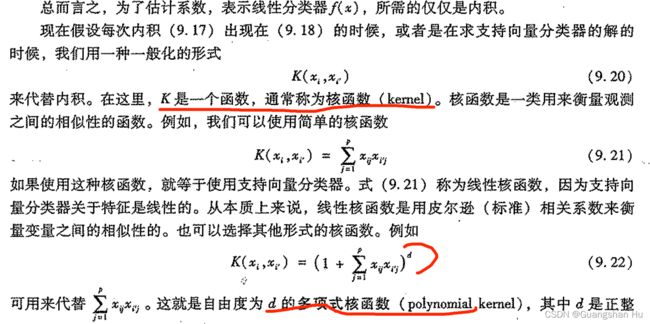
SVM支持向量机
Maximal Margin Classifier最大间隔分类器 (最大化M margin)


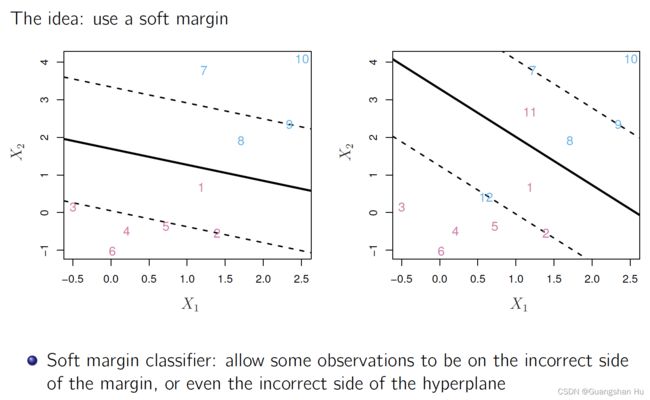
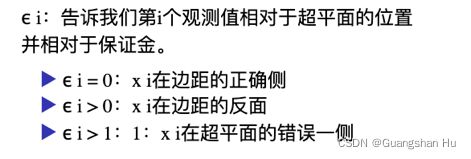
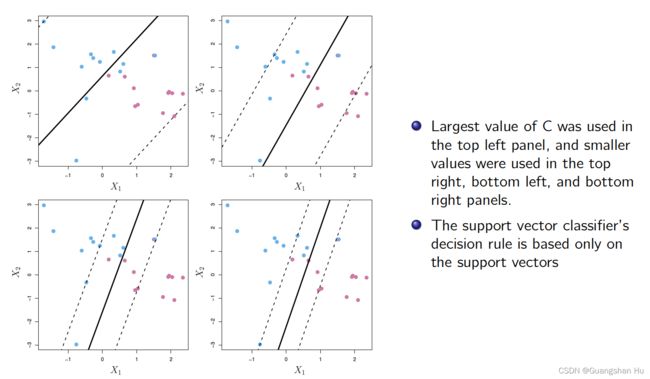
Support Vector Classifiers 支持向量分类器


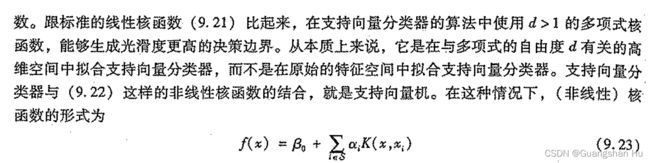
Support Vector Machines 狭义支持向量机


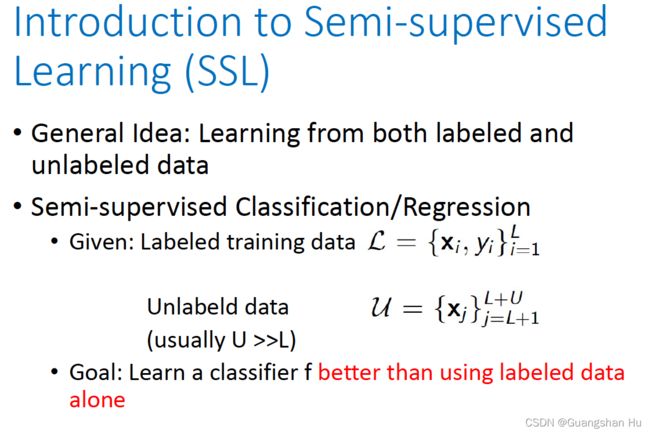
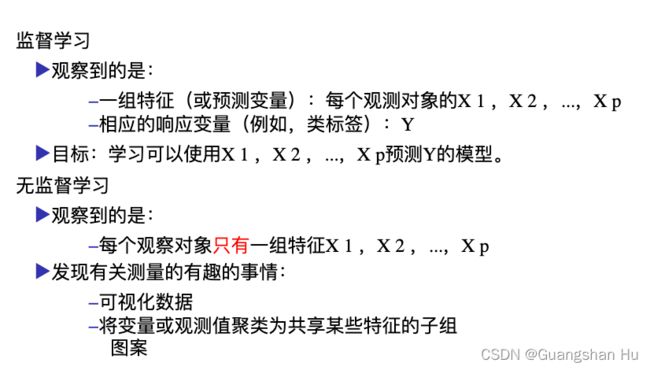
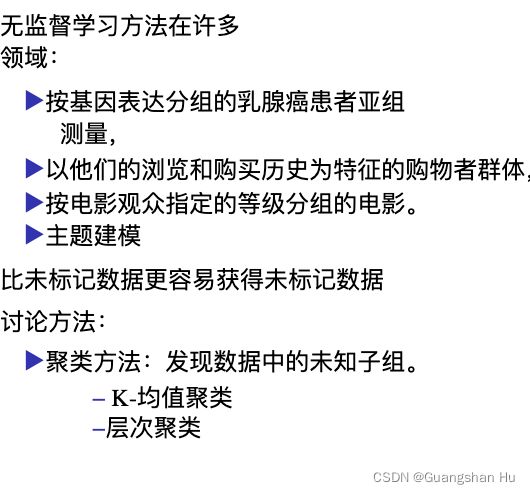
无监督学习


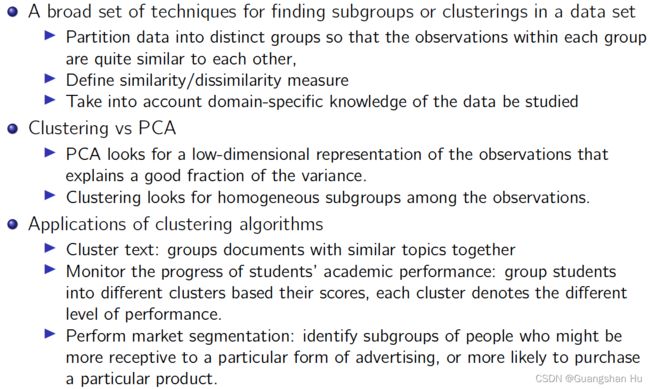
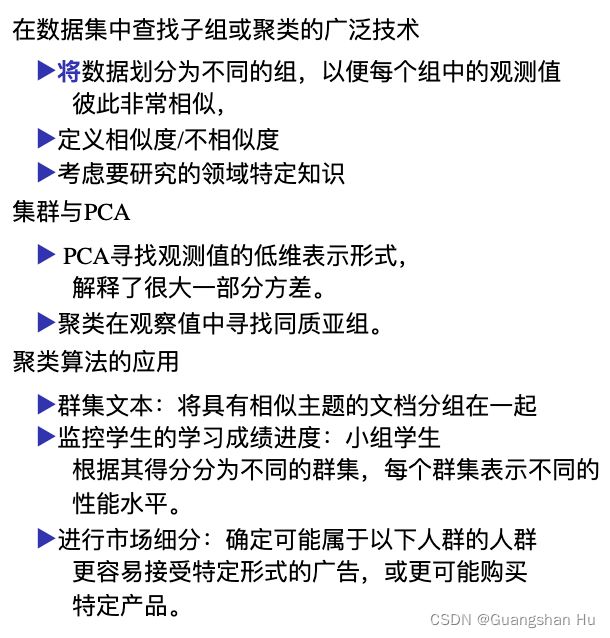


分层聚类