【Opencv】基于Opencv和PCV两种方法的Harris 角点检测与匹配
【Opencv】基于Opencv和PCV两种方法的Harris 角点检测与匹配【附代码】
-
- 理解Harris角点检测
- 代码:Harris角点检测
-
- 1.【opencv版】Harris角点检测
- 2.【PCV版】Harris角点检测与匹配
- 3.【PCV版】Harris匹配
理解Harris角点检测
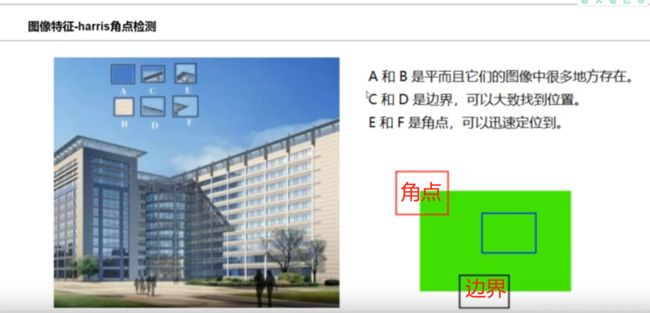
明确两个概念:
边界——一面比较平稳变换,一面比较明显
角点——无论是水平还是竖直方向,变化都很明显
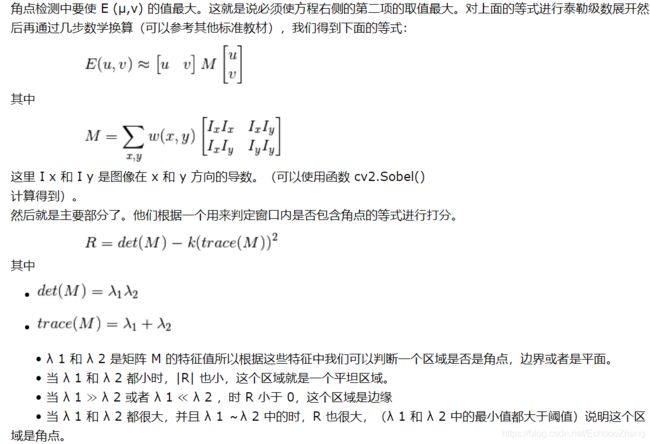
Chris_Harris 和 Mike_Stephens 早在 1988 年的文章《A CombinedCorner and Edge Detector》中就已经提出了焦点检测的方法,被称为Harris 角点检测。他把这个简单的想法转换成了数学形式。将窗口向各个方向移动(u,v)然后计算所有差异的总和。

图示结论:

Harris 角点检测的结果:是一个由角点分数构成的灰度图像。选取适当的阈值对结果图像进行二值化我们就检测到了图像中的角点。
代码:Harris角点检测
通过摸索,发现有两个python工具包可用:一个是cv2,另外一个是PCV——(但这个里面是与Python2.x适配,需要自己改一改里面源代码),分别试验一下。
1.【opencv版】Harris角点检测
函数 cv2.cornerHarris() 可以用来进行角点检测。
参数如下:
• img - 数据类型为 float32 的输入图像。
• blockSize - 角点检测中要考虑的领域大小。
• ksize - Sobel 求导中使用的窗口大小
• k - Harris 角点检测方程中的自由参数,取值参数为 [0,04,0.06].
from matplotlib import pyplot as plt
import cv2
import numpy as np
def pltshow(imgs,titles):
    for i in range(len(imgs)):
        plt.subplot(2, len(imgs)/2+1, i + 1), plt.imshow(imgs[i], 'gray')
        plt.title(titles[i])
        plt.xticks([]), plt.yticks([])
    plt.show()


def cvshow(name,img):
    cv2.imshow(name,img)
    cv2.waitKey(0)
    cv2.destroyAllWindows()


def getimg(path,flag):
    img = cv2.imread(path)
    b, g, r = cv2.split(img)
    img_c = cv2.merge([r, g, b])
    img_gray = cv2.cvtColor(img, cv2.COLOR_RGB2GRAY)
    if flag==0:
        return img
# 若要用Matplot显示就先把bgr转换成rgb,img_c显示即可,opencv imshow时仍用img
    elif flag==1:
        return img_c
    elif flag==2:
        return img_g

#图像特征harris角点检测
img=getimg('d:/wall.jpg',0)
print('img.shape',img.shape)
gray=cv2.cvtColor(img,cv2.COLOR_RGB2GRAY)
dst=cv2.cornerHarris(gray,2,3,0.04)
print('dst.shape',dst.shape)

#做一个非极大值抑制,
#对比几种情况,当dst越大的时候,角点更容易出现,否则边界会出现很多
orig1=img.copy()
orig2=img.copy()
orig3=img.copy()
orig1[dst>0.02*dst.max()]=[0,0,255]
orig2[dst>0.1*dst.max()]=[0,0,255]
orig3[dst>0.2*dst.max()]=[0,0,255]

res=np.hstack((orig1,orig2,orig3))
cvshow('dst',res)
结果:
2.【PCV版】Harris角点检测与匹配
# -*- coding: utf-8 -*-
from pylab import *
from PIL import Image
from PCV.localdescriptors import harris
# PCV harris角点检测
# 读入图像
img=getimg('d:/wall.jpg',0)
im=getimg('d:/wall.jpg',1)
gray=getimg("d:/wall.jpg",2)

# 检测harris角点
harrisim = harris.compute_harris_response(gray)

plt.suptitle("Harris corners")
plt.imshow(harrisim)
plt.axis('off')
plt.show()

# Harris响应函数
harrisim1 = 255 - harrisim

#画出Harris响应图
#画出Harris响应图

plt.suptitle("Harris corners")
plt.imshow(harrisim1)
print (harrisim1.shape)
plt.axis('off')
plt.show()

threshold = [0.01, 0.05, 0.1]
for i, thres in enumerate(threshold):
    filtered_coords = harris.get_harris_points(harrisim, 6, thres)


plt.imshow(im)
print (im.shape)
plt.plot([p[1] for p in filtered_coords], [p[0] for p in filtered_coords], '+c')
plt.axis('off')
plt.show()


# cv2 Harris角点检测
dst=cv2.cornerHarris(gray,2,3,0.04)
print(dst.shape)
img[dst>0.15*dst.max()]=[255,0,0]
cvshow('cv2Harris',img)
3.【PCV版】Harris匹配
from pylab import *
from PIL import Image

from PCV.localdescriptors import harris

o1=getimg('d:/zgg1.jpg',1)
o2=getimg('d:/zgg2.jpg',1)
im1 = getimg('d:/zgg1.jpg',2)
im2 = getimg('d:/zgg2.jpg',2)

# resize to make matching faster
o1 = cv2.resize(o1, (int(o1.shape[1]/2), int(o1.shape[0]/2)))
o2 = cv2.resize(o2, (int(o2.shape[1]/2), int(o2.shape[0]/2)))
im1 = cv2.resize(im1, (int(im1.shape[1]/2), int(im1.shape[0]/2)))
im2 = cv2.resize(im2, (int(im2.shape[1]/2), int(im2.shape[0]/2)))

wid = 5
harrisim = harris.compute_harris_response(im1, 5)
filtered_coords1 = harris.get_harris_points(harrisim, wid+1)
d1 = harris.get_descriptors(im1, filtered_coords1, wid)

harrisim = harris.compute_harris_response(im2, 5)
filtered_coords2 = harris.get_harris_points(harrisim, wid+1)
d2 = harris.get_descriptors(im2, filtered_coords2, wid)

print ('starting matching')
matches = harris.match_twosided(d1, d2)

plt.figure()
plt.suptitle("Harris matching")
plt.gray()
harris.plot_matches(im1, im2, filtered_coords1, filtered_coords2, matches)
plt.show()
附:原图


再附上:
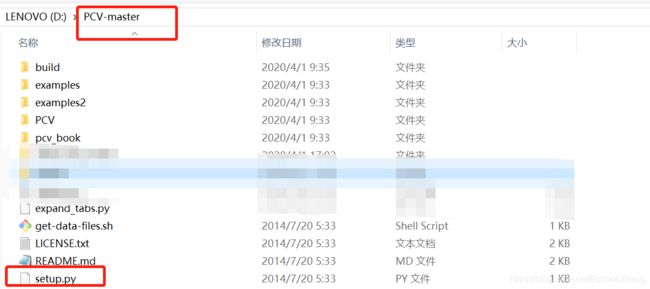
PCV下载包,下载后解压。
链接:https://pan.baidu.com/s/1e6gU6BOg1En8ujkS5vKZ2g
提取码:ucgw
复制这段内容后打开百度网盘手机App,操作更方便哦
在此目录下cmd运行python setup.exe install 即可。
--------2020/04/01-----EchoZhang觉得SIFT成功够呛--------


