基于逻辑回归和xgboost算法的信用卡欺诈检测(python)
基于逻辑回归和xgboost算法的信用卡欺诈检测
-
- 认识数据
- 数据规范化
- 数据分组
- SMOTE过采样算法
- 混淆矩阵
- k折交叉验证逻辑回归算法
- XGBoost算法
- 参考博客
认识数据
import pandas as pd
import numpy as np
import matplotlib.pyplot as plt
%matplotlib inline
import sklearn as sklearn
import xgboost as xgb  #xgboost
from imblearn.over_sampling import SMOTE
from sklearn.ensemble import RandomForestClassifier
from sklearn.metrics import confusion_matrix
from sklearn.model_selection import train_test_split
from sklearn.ensemble import RandomForestClassifier   ##随机森林

data = pd.read_csv("E:/creditcard.csv")
data.head()
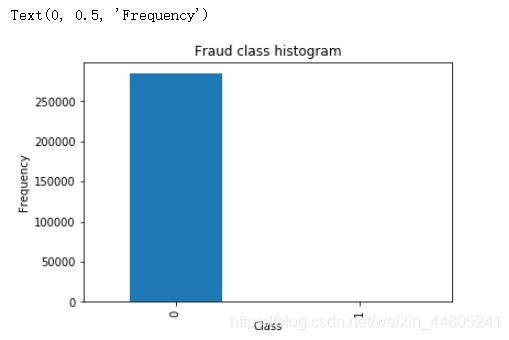
本文数据样本来源于2013年9月欧洲持卡人在两天内进行的284808笔信用卡交易,其中有493笔欺诈交易。由于保密问题,只包含作为PCA转化结果的数字输入变量,特征V1,V2,… V28是使用PCA获得的主要组件,交易金额是常量,是否欺诈(class)是分类变量。


data.groupby('Class').size()
count_classess = pd.value_counts(data['Class'],sort=True)
count_classess.plot(kind = 'bar')
plt.title('Fraud class histogram')
plt.xlabel('Class')
plt.ylabel('Frequency')
数据规范化
观察数据可知,由于数据除交易金额(Amount)和是否欺诈(class)外,其他变量已经过PAC处理,由于交易金额过于分散,对amount进行数据规范化处理后得到列nomAmount。
from sklearn.preprocessing import StandardScaler
#StandardScaler作用:去均值和方差归一化。且是针对每一个特征维度来做的,而不是针对样本。
data['normAmount'] = StandardScaler().fit_transform(data['Amount'].values.reshape(-1, 1))
data = data.drop(['Time','Amount'],axis=1)
data.head()
数据分组
在开始建模前对数据集进行划分,将数据集的80%作为训练集,20%作为测试集。即227454条数据为训练集,其他为测试集数据。利用训练集来训练模型,用测试集来验证构建的模型。同下方解决数据不平衡问题时一起分组,
SMOTE过采样算法
解决样本数据不平衡的问题
SMOTE(Synthetic Minority Oversampling Technique)即合成少数类过采样技术,它是基于随机过采样算法的一种改进方案,由于随机过采样简单复制样本的策略来增加少数类样本,这样容易产生模型过拟合的问题,使得模型学习的信息过于特别而不够泛化,SMOTE算法的基本思想是对少数类样本进行分析并根据少数类样本人工合成新样本添加到数据集中。
1、对于少数类中每一个样本x,以欧氏距离为标准计算它到少数类样本集中所有样本的距离,得到其k近邻。
2、根据样本不平衡比例设置一个采样比例以确定采样倍率N,对于每一个少数类样本x,从其k近邻中随机选择若干个样本,假设选择的近邻为xn。
3、对于每一个随机选出的近邻xn,分别与原样本按照如下的公式构建新的样本


SMOTE算法的缺陷:该算法主要存在两方面的问题:一是在近邻选择时,存在一定的盲目性。从上面的算法流程可以看出,在算法执行过程中,需要确定K值,即选择多少个近邻样本,这需要用户自行解决。从K值的定义可以看出,K值的下限是M值(M值为从K个近邻中随机挑选出的近邻样本的个数,且有M< K),M的大小可以根据负类样本数量、正类样本数量和数据集最后需要达到的平衡率决定。但K值的上限没有办法确定,只能根据具体的数据集去反复测试。因此如何确定K值,才能使算法达到最优这是未知的。另外,该算法无法克服非平衡数据集的数据分布问题,容易产生分布边缘化问题。由于负类样本的分布决定了其可选择的近邻,如果一个负类样本处在负类样本集的分布边缘,则由此负类样本和相邻样本产生的“人造”样本也会处在这个边缘,且会越来越边缘化,从而模糊了正类样本和负类样本的边界,而且使边界变得越来越模糊。这种边界模糊性,虽然使数据集的平衡性得到了改善,但加大了分类算法进行分类的难度。
columns=data.columns
# 为了获得特征列,移除最后一列标签列
features_columns=columns.drop(['Class'])
features = data[features_columns]
labels=data['Class']
features_train, features_test, labels_train, labels_test = train_test_split(features, labels, test_size=0.2, random_state=0)
oversampler = SMOTE(random_state=0)
x_train,y_train = oversampler.fit_sample(features_train,labels_train)
print('SMOTE过采样后,训练集中1的样本的个数为:',len(y_train[y_train==1]))
print('SMOTE过采样后,训练集中0的样本的个数为:',len(y_train[y_train==0]))
x_test,y_test = oversampler.fit_sample(features_test,labels_test)
print('SMOTE过采样后,测试集1的样本的个数为:',len(y_test[y_test==1]))
print('SMOTE过采样后,测试集0的样本的个数为:',len(y_test[y_test==0]))
通过SMOTE过采样后,欺诈交易(class=1)和正常交易的数据量相等,解决了数据不平衡的问题
混淆矩阵
import itertools as itt
def plot_confusion_matrix(cm, classes,title='Confusion matrix',cmap=plt.cm.Blues):
    '''这个方法用来输出和画出混淆矩阵的
    '''
    #cm为数据,interpolation='nearest'使用最近邻插值,cmap颜色图谱(colormap), 默认绘制为RGB(A)颜色空间
    plt.imshow(cm,interpolation='nearest',cmap=cmap)
    plt.title(title)
    plt.colorbar()
    tick_marks = np.arange(len(classes))
    #xticks(刻度下标,刻度标签)
    plt.xticks(tick_marks, classes, rotation=0)
    plt.yticks(tick_marks, classes)
    #text()命令可以在任意的位置添加文字
    thresh = cm.max() / 2.
    for i, j in itt.product(range(cm.shape[0]), range(cm.shape[1])):
        plt.text(j, i, cm[i, j],
                 horizontalalignment="center",
                 color="white" if cm[i, j] > thresh else "black")
    #自动紧凑布局
    plt.tight_layout()
    plt.ylabel('True label')
    plt.xlabel('Predicted label')
k折交叉验证逻辑回归算法
from sklearn.linear_model import LogisticRegression
from sklearn.model_selection import KFold,cross_val_score
from sklearn.metrics import confusion_matrix,recall_score,classification_report
def printing_Kfold_scores(x_train_data,y_train_data):
    #k折交叉验证
    fold = KFold(n_splits=5,shuffle=False)
    #不同的C参数
    c_param_range = [0.01,0.1,10,100,1000]
    results_table = pd.DataFrame(index = range(len(c_param_range),2), columns = ['C_parameter','Mean recall score'])
    results_table['C_parameter'] = c_param_range
    #k折操作将会给出两个列表:train_indices = indices[0], test_indices = indices[1]
    j = 0
    for c_param in c_param_range:
        print('-------------------------------------------')
        print('C parameter: ', c_param)
        print('-------------------------------------------')
        print('')
        recall_accs = []
        #enumerate() 函数用于将一个可遍历的数据对象(如列表、元组或字符串)组合为一个索引序列,同时列出数据和数据下标,一般用在 for 循环当中。
        for iteration,indices in enumerate(fold.split(x_train_data)):
            #把c_param_range代入到逻辑回归模型中,并使用了l1正则化
            lr = LogisticRegression(C = c_param,penalty = 'l1',solver='liblinear')
            #使用indices[0]的数据进行拟合曲线,使用indices[1]的数据进行误差测试
            lr.fit(x_train_data.iloc[indices[0],:],y_train_data.iloc[indices[0],:].values.ravel())
            #在indices[1]数据上预测值
            y_pred_undersample = lr.predict(x_train_data.iloc[indices[1],:].values)
            #根据不同的c_parameter计算召回率
            recall_acc = recall_score(y_train_data.iloc[indices[1],:].values,y_pred_undersample)
            recall_accs .append(recall_acc)
            print('Iteration ', iteration,': recall score = ', recall_acc)
        #求出我们想要的召回平均值
        results_table.loc[j,'Mean recall score'] = np.mean(recall_accs)
        j += 1
        print('')
        print('Mean recall score ', np.mean(recall_accs))
        print('')
    best_c = results_table.loc[results_table['Mean recall score'].values.argmax()]['C_parameter']
    #最后选择最好的 C parameter
    print('*********************************************************************************')
    print('Best model to choose from cross validation is with C parameter = ', best_c)
    print('*********************************************************************************')
    return best_c

##结果##
-------------------------------------------
C parameter:  10
-------------------------------------------

Iteration  0 : recall score =  0.9161290322580645
Iteration  1 : recall score =  0.9144736842105263
Iteration  2 : recall score =  0.9114307845523957
Iteration  3 : recall score =  0.8942636374627669
Iteration  4 : recall score =  0.895120959321177

Mean recall score  0.9062836195609861

-------------------------------------------
C parameter:  100
-------------------------------------------

Iteration  0 : recall score =  0.9161290322580645
Iteration  1 : recall score =  0.9144736842105263
Iteration  2 : recall score =  0.9114086533141529
Iteration  3 : recall score =  0.8944504896626768
Iteration  4 : recall score =  0.894912124509513

Mean recall score  0.9062747967909865

-------------------------------------------
C parameter:  1000
-------------------------------------------

Iteration  0 : recall score =  0.9161290322580645
Iteration  1 : recall score =  0.9144736842105263
Iteration  2 : recall score =  0.9114307845523957
Iteration  3 : recall score =  0.8944504896626768
Iteration  4 : recall score =  0.8951539332388081

Mean recall score  0.9063275847844942

*********************************************************************************
Best model to choose from cross validation is with C parameter =  1000
*********************************************************************************
####################################

x_train1 = pd.DataFrame(x_train)
y_train1 = pd.DataFrame(y_train)
best_c = printing_Kfold_scores(x_train1,y_train1)

#逻辑回归计算混淆矩阵以及召回率
lr = LogisticRegression
lr=lr(C = best_c, penalty = 'l1',solver='liblinear')
lr.fit(x_train,y_train.values.ravel())
y_pred = lr.predict(x_test.values)

from sklearn import metrics
print ('AUC: %.4f' % metrics.roc_auc_score(y_test,y_pred))
print ('ACC: %.4f' % metrics.accuracy_score(y_test,y_pred))
print ('Recall: %.4f' % metrics.recall_score(y_test,y_pred))
print ('F1-score: %.4f' %metrics.f1_score(y_test,y_pred))
print ('Precesion: %.4f' %metrics.precision_score(y_test,y_pred))
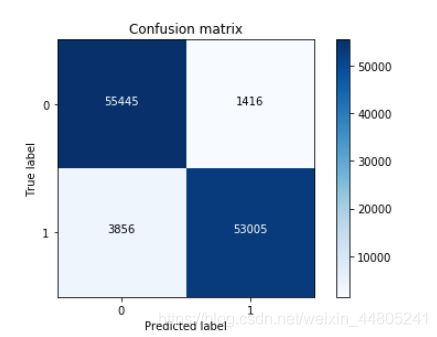
print(metrics.confusion_matrix(y_test,y_pred))

# 计算混淆矩阵
cnf_matrix = confusion_matrix(y_test,y_pred)
np.set_printoptions(precision=2)
print("Recall metric in the testing dataset: ",
      cnf_matrix[1,1]/(cnf_matrix[1,0]+cnf_matrix[1,1]))
# 画出非规范化的混淆矩阵
class_names = [0,1]
plt.figure()
plot_confusion_matrix(cnf_matrix
                      , classes=class_names
                      , title='Confusion matrix')
plt.show()
##结果##
AUC: 0.9536
ACC: 0.9536
Recall: 0.9322
F1-score: 0.9526
Precesion: 0.9740
[[55445  1416]
 [ 3856 53005]]
KS: 0.9036246284799775
Recall metric in the testing dataset:  0.9321855050034294
XGBoost算法
xg_train = xgb.DMatrix( x_train, label=y_train)
xg_test = xgb.DMatrix(x_test, label=y_test)
#1.训练模型
# setup parameters for xgboost
from sklearn.metrics import mean_squared_error
params={
    'booster': 'gbtree',             #决定那个使用那个booster,可以是gbtree,gblinear或者dart。 gbtree和dart使用基于树的模型,而gblinear 使用线性函数.
    'objective': 'binary:logistic',  # 单分类的问题
    'gamma': 0.01,                  # 用于控制是否后剪枝的参数,越大越保守,一般0.1、0.2这样子。
    'max_depth': 12,               # 构建树的深度,越大越容易过拟合
    'subsample':0.1 ,             #用于训练模型的子样本占整个样本集合的比例。如果设置为0.5则意味着XGBoost将随机的冲整个样本集合中随机的抽取出50%的子样本建立树模型,这能够防止过拟合。取值范围为:(0,1]
    'lambda': 0.1,                   # 控制模型复杂度的权重值的L2正则化项参数,参数越大,模型越不容易过拟合。
    'subsample': 0.1,              # 随机采样训练样本
    'colsample_bytree': 0.9 ,       # 生成树时进行的列采样
    'colsample_bylevel':1 ,
    'min_child_weight': 2,
    'max_delta_step':5,
    'eta': 4  ,                  # 如同学习率
    'nthread': 4,               # cpu 线程数
    #'seed':27,
    #'n_estimators':1000,
    #'silent': 0,                   # 设置成1则没有运行信息输出,最好是设置为0.
    'learning_rate':0.3
    }
watchlist = [ (xg_train,'train'), (xg_test, 'test') ]
num_round = 8#迭代次数
bst = xgb.train(params, xg_train, num_round, watchlist );
pred = bst.predict( xg_test );

# 设置阈值, 输出一些评价指标,选择概率大于0.5的为1,其他为0类
y_pred = (pred >= 0.5)*1

from sklearn import metrics
print ('AUC: %.4f' % metrics.roc_auc_score(y_test,y_pred))
print ('ACC: %.4f' % metrics.accuracy_score(y_test,y_pred))
print ('Recall: %.4f' % metrics.recall_score(y_test,y_pred))
print ('F1-score: %.4f' %metrics.f1_score(y_test,y_pred))
print ('Precesion: %.4f' %metrics.precision_score(y_test,y_pred))
print(metrics.confusion_matrix(y_test,y_pred))

y_predict_proba = bst.predict( xg_test )
fpr, tpr,_= sklearn.metrics.roc_curve(np.array(y_test), y_predict_proba)
print('KS:', max(abs(tpr-fpr)))

#bst.dump_model("model.txt")
#ypred_contribs = bst.predict(xg_test, pred_contribs=True)
#ypred_contribs
#names = df.columns

cnf_matrix = confusion_matrix(y_test,y_pred)
np.set_printoptions(precision=2)
print("Recall metric in the testing dataset: ",
      cnf_matrix[1,1]/(cnf_matrix[1,0]+cnf_matrix[1,1]))
# 画出非规范化的混淆矩阵
class_names = [0,1]
plt.figure()
plot_confusion_matrix(cnf_matrix
                      , classes=class_names
                      , title='Confusion matrix')
plt.show()
参考博客
https://blog.csdn.net/huahuaxiaoshao/article/details/85232089


