Regression Chapter 8
目录
EX1
table8.2
使用Cochrane and Orcutt方法进行变量变换
Ex2 analysis of housing starts
存在强自相关,引入变量Dt
Ex3
拟合模型
忽视了季节效应,引入指示变量去消除
EX1
import numpy as np
import pandas as pd
import matplotlib.pyplot as plt
import statsmodels.api as sm
import statsmodels.stats.outliers_influence # 异常值检验
data=pd.read_csv("C:/Users/可乐怪/Desktop/csv/P199.csv")
data['constant']=1table8.2
model=sm.OLS(data['Expenditure'],data[['constant','Stock']]).fit()
print(model.summary())
np.round(model.params,2)
OLS Regression Results ============================================================================== Dep. Variable: Expenditure R-squared: 0.957 Model: OLS Adj. R-squared: 0.955 Method: Least Squares F-statistic: 403.2 Date: Thu, 11 Nov 2021 Prob (F-statistic): 8.99e-14 Time: 14:13:22 Log-Likelihood: -54.964 No. Observations: 20 AIC: 113.9 Df Residuals: 18 BIC: 115.9 Df Model: 1 Covariance Type: nonrobust ============================================================================== coef std err t P>|t| [0.025 0.975] ------------------------------------------------------------------------------ constant -154.7192 19.850 -7.794 0.000 -196.423 -113.016 Stock 2.3004 0.115 20.080 0.000 2.060 2.541 ============================================================================== Omnibus: 2.018 Durbin-Watson: 0.328 Prob(Omnibus): 0.365 Jarque-Bera (JB): 1.446 Skew: -0.453 Prob(JB): 0.485 Kurtosis: 2.044 Cond. No. 3.86e+03 ============================================================================
constant   -154.72
Stock         2.30
dtype: float64
outliers=model.get_influence()
res=outliers.resid_studentized_internal
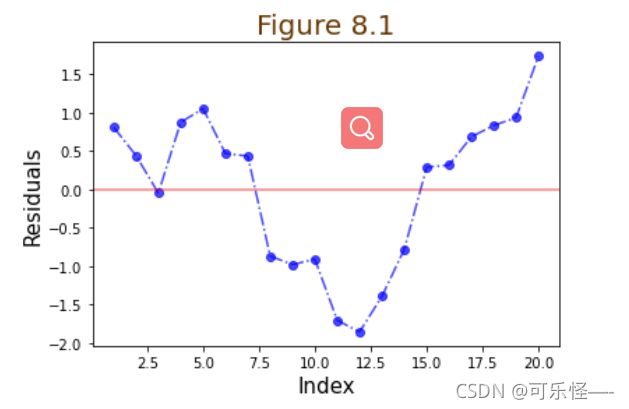
index=range(1,21,1)
plt.xlabel('Index',size=15)
plt.ylabel('Residuals',size=15)
plt.title('Figure 8.1',size=20,c="#653700")
plt.plot(index,res,'bo-.',alpha=0.7)
plt.axhline(y=0,ls="-",c="r",alpha=0.5)#添加水平直线
plt.show()存在自相关
def runs(res):#游程检验
    n1=0
    n2=0
    for i in res:
        if i>0:
            n1+=1
        else:
            n2+=1
    μ=(2*n1*n2)/(n1+n2)+1
    σ=(((2*n1*n2*(2*n1*n2-n1-n2)))/((n1+n2)**2)/(n1+n2-1))**0.5
    return μ,σ

print("游程检验的均值和标准差为:\n",runs(res))
def DW1(y,x):
model=sm.OLS(y,x).fit()
res=y-model.fittedvalues
sse=model.ssr#ols模型的残差平方和
e=[res[i]-res[i-1] for i in range(1,len(y))]
e=np.sum(np.power(e, 2))#e^2
d=np.round(e/sse,3)
ρ1=1-d/2
e2=[res[i]*res[i-1] for i in range(1,len(y))]
e2=np.sum(e2)
ρ2 = np.round(e2/ sse,3)
return d,ρ1,ρ2
print("d=%s,ρ1=%sρ2=%s"%(DW1(data['Expenditure'],data[['constant','Stock']])))
ρ2=DW1(data['Expenditure'],data[['constant','Stock']])[2]
global ρ2d=0.328 得到新的方程y_new=-53.64+x_new*2.64¶ 原变量表示的方程:y=-215.422+x*2.64 d=1.427,ρ1=0.2865 ρ2=0.24 d=1.852>dL,acceptHo不存在自相关 如图季节效应被消除了¶ 使用Cochrane and Orcutt方法进行变量变换
y_new=[data['Expenditure'][i]-(ρ2)*data['Expenditure'][i-1] for i in range(1,len(data['Expenditure']))]
x_new=[data['Stock'][i]-(ρ2)*data['Stock'][i-1] for i in range(1,len(data['Expenditure']))]
data_new=pd.DataFrame({'y_new':y_new,'x_new':x_new,'constant':1})
model2=sm.OLS(data_new['y_new'],data_new[['constant','x_new']]).fit()
print(model2.summary())
np.round(model2.params,2)

model2.ssrβ0=-53.64/(1-0.751)
np.round(β0,3)outliers=model2.get_influence()
res=outliers.resid_studentized_internal
index=range(1,20,1)
plt.plot(index,res,'bo-.',alpha=0.7)
plt.xlabel('Index',size=15)
plt.ylabel('Residuals',size=15)
plt.title('Figure 8.2',size=20,c="#653700")
plt.axhline(y=0,ls="-",c="r",alpha=0.5)#添加水平直线
plt.show()
def DW2(y,x):
model2=sm.OLS(y,x).fit()
res=y-model2.fittedvalues
sse=model2.ssr
e=[res[i]-res[i-1] for i in range(1,len(y))]
e=np.sum(np.power(e, 2))#e^2
d=np.round(e/sse,3)
ρ1=1-d/2
e2=[res[i]*res[i-1] for i in range(1,len(y))]
e2=np.sum(e2)
ρ2 = np.round(e2/ sse,3)
return d,ρ1,ρ2
print("d=%s,ρ1=%sρ2=%s"%(DW2(data_new['y_new'],data_new[['constant','x_new']])))
d=1.427>dL,acceptHo不存在自相关Ex2 analysis of housing starts
data=pd.read_csv("C:/Users/可乐怪/Desktop/csv/P207.csv")
data['constant']=1

model=sm.OLS(data['H'],data[['constant','P']]).fit()
print(model.summary())

outliers=model.get_influence()
res=outliers.resid_studentized_internal
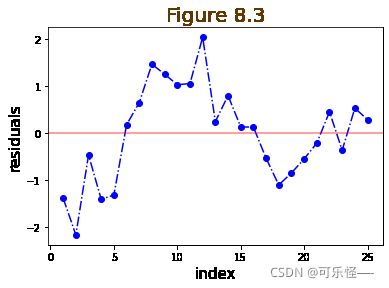
index=range(1,26)
plt.plot(index,res,'bo-.')
plt.xlabel("index",size=15)
plt.ylabel("residuals",size=15)
plt.title('Figure 8.3',size=20,c="#653700")
plt.axhline(y=0,ls="-",c="r",alpha=0.5)#添加水平直线
plt.show()
存在强自相关,引入变量Dt
model2=sm.OLS(data['H'],data[['constant','P','D']]).fit()
print(model2.summary())

outliers=model3.get_influence()
res2=outliers.resid_studentized_internal
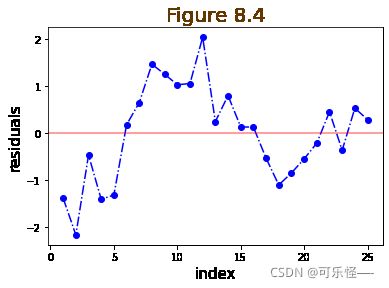
index=range(1,26)
plt.plot(index,res2,'bo-.')
plt.xlabel("index",size=15)
plt.ylabel("residuals",size=15)
plt.title('Figure 8.4',size=20,c="#653700")
plt.axhline(y=0,ls="-",c="r",alpha=0.5)#添加水平直线
plt.show()
Ex3
拟合模型
data=pd.read_csv("C:/Users/可乐怪/Desktop/csv/P212.csv")
data['constant']=1
data['index']=range(0,40)

model=sm.OLS(data['Sales'],data[['PDI','constant']]).fit()
print(model.summary())

outliers=model.get_influence()
res=outliers.resid_studentized_internal
data['res']=res
data2=data.loc[data['Season']==1]#通过行标签索引行数据
data3=data.loc[data['Season']==0]
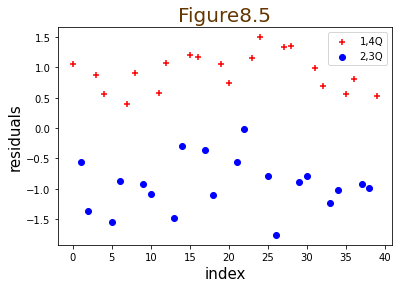
plt.scatter(data2['index'],data2['res'],c='r',marker='+')
plt.scatter(data3['index'],data3['res'],c='b',marker='o')
plt.xlabel("index",size=15)
plt.ylabel("residuals",size=15)
plt.title("Figure8.5",size=20,c="#653700")
plt.legend(['1,4Q','2,3Q'])#
plt.show()
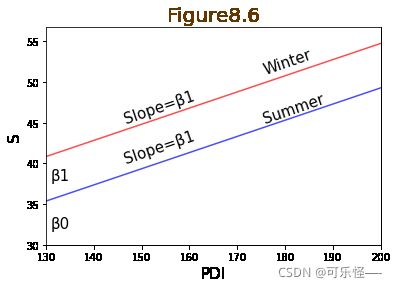
忽视了季节效应,引入指示变量去消除
data2=data.loc[data['Season']==1]#通过行标签索引行数据
data3=data.loc[data['Season']==0]

model2=sm.OLS(data2['Sales'],data2[['constant','PDI']]).fit()
model3=sm.OLS(data3['Sales'],data3[['constant','PDI']]).fit()
fit2=model2.fittedvalues
fit3=model3.fittedvalues
plt.plot(data2['PDI'],fit2,c='r',alpha=0.7)
plt.plot(data3['PDI'],fit3,c='b',alpha=0.7)
plt.yticks([])#取消坐标刻度
plt.xticks([])
plt.ylim(30)
plt.xlim(130,200)#plt.xlim(xmin,xmax)----xmin:x轴上的显示下限 xmax:x轴上的显示上限
plt.xlabel("PDI",size=15)
plt.ylabel("S",size=15)
plt.title("Figure8.6",size=20,c="#653700")
plt.text(146,45,"Slope=β1",rotation=19,size=15)#给图中的点加标签
plt.text(175,51,"Winter",rotation=19,size=15)
plt.text(146,40,"Slope=β1",rotation=19,size=15)
plt.text(175,45,"Summer",rotation=19,size=15)
plt.text(131,32,'β0',size=15)
plt.text(131,38,'β1',size=15)
plt.show()
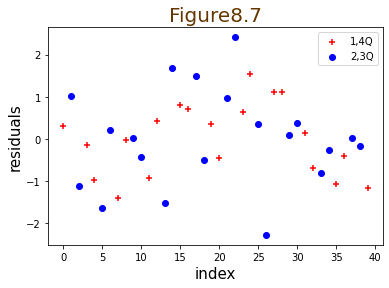
model2=sm.OLS(data['Sales'],data[['constant','PDI','Season']]).fit()
print(model2.summary())
model2.conf_int()

outliers2=model2.get_influence()
res2=outliers2.resid_studentized_internal
data['res2']=res2
data2=data.loc[data['Season']==1]#通过行标签索引行数据
data3=data.loc[data['Season']==0]
plt.scatter(data2['index'],data2['res2'],c='r',marker='+')
plt.scatter(data3['index'],data3['res2'],c='b',marker='o')
plt.xlabel("index",size=15)
plt.ylabel("residuals",size=15)
plt.title("Figure8.7",size=20,c="#653700")
plt.legend(['1,4Q','2,3Q'])#
plt.show()
