数据可视化——seaborn绘图01
seaborn绘图01
论文里的可视化可以用这个画
http://seaborn.pydata.org/
seaborn可绘制漂亮的图表
seaborn是数据分析而设置的绘图库
seaborn能与Pandas很好结合
安装:
用pip命令安装seaborn:pip install seaborn
import seaborn as sns
sns.version #检查是否安装成功
Seaborn绘制图表分类
分类图:柱状图barplot、箱线图boxplot、小提琴图viol inplot、散点图(stripplot、 swarmplot)、以及分面网格(FacetGrid)、分类图catplot。
关联图:散点图scatterplot、线图lineplot,以及分面网格(FacetGrid)、关联图relplot。
分布图:单变量分布图distplot、密度图kdeplot。
矩阵图:热力图heatmap、聚类图clustermap。
回归图:线性回归图regplot和分面网格(FacetGrid) 线性回归图lmplot。
分面网格图: FacetGrid。
Seaborn内置数据集
Seaborn内置数据集可以通过load_dataset函数加载数据集,返回DataFrame对象,语法如下:
**seaborn.load_dataset(name,cache=True,data_home=None, kws)
name参数是数据集名字
data定义数据集名。
cache 参数是否提供缓存。
data_home 参数是指定缓存路径,默认当前用户home下的seaborn-data目录中。
sns.get_dataset_names()获得数据集名字
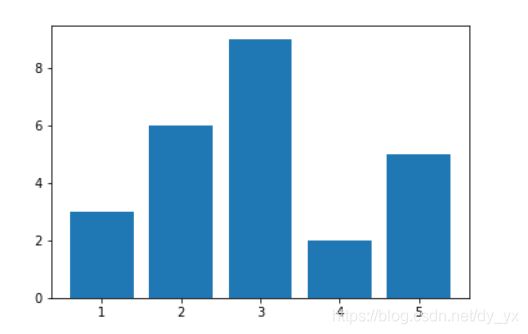
plt.bar([1,2,3,4,5],[3,6,9,2,5]) #原始的柱状图
Seaborn中有五种可供选择的主题:
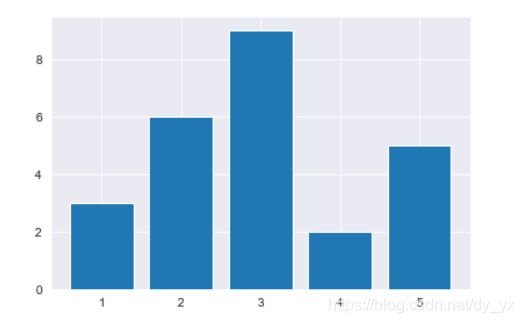
1.darkgrid(灰色网格)
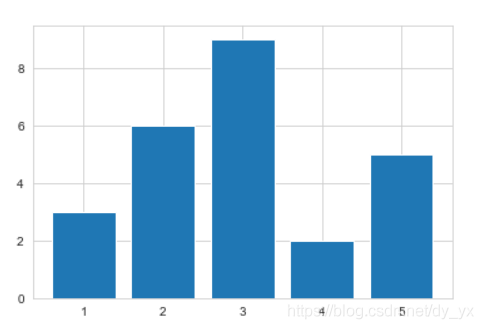
2.whitegrid(白色网格)
3.dark(黑色)
4.white(白色)
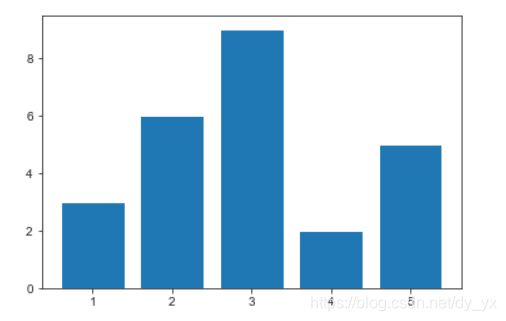
5.ticks(十字叉)
sns.set_style("darkgrid") #主题设置
plt.bar([1,2,3,4,5],[3,6,9,2,5])
sns.set_style("whitegrid") #主题设置
plt.bar([1,2,3,4,5],[3,6,9,2,5])
sns.set_style("ticks") #主题设置
plt.bar([1,2,3,4,5],[3,6,9,2,5])
sns.set_style("white") #主题设置
plt.bar([1,2,3,4,5],[3,6,9,2,5])
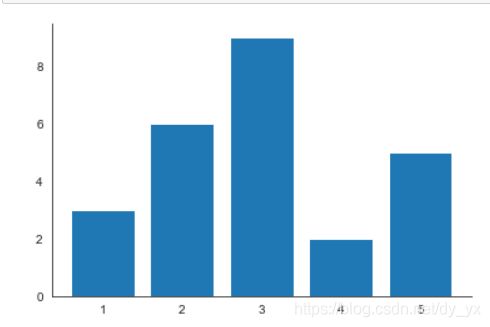
sns.despine()  #去除seaborn图脊,默认去除上边和右边
sns.set_style("white") #主题设置
plt.bar([1,2,3,4,5],[3,6,9,2,5])
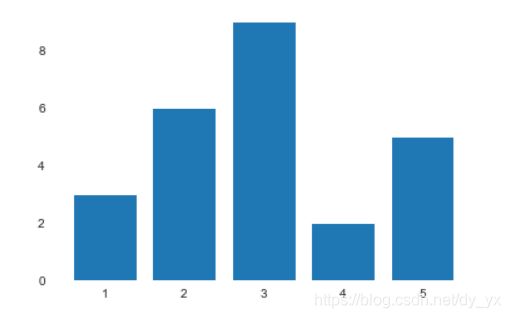
sns.despine(left=True,bottom=True)  #去除seaborn图脊,默认去除上边和右边
sns.set_style("white") #主题设置
plt.bar([1,2,3,4,5],[3,6,9,2,5])
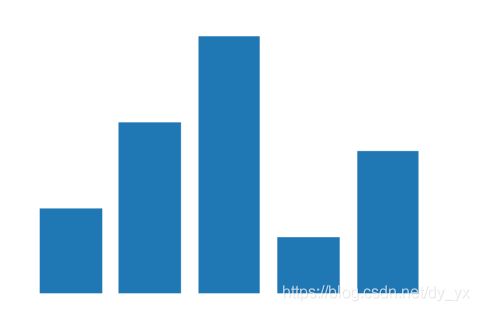
sns.despine(left=True,bottom=True)  #去除seaborn图脊,默认去除上边和右边
plt.xticks([])
plt.yticks([])
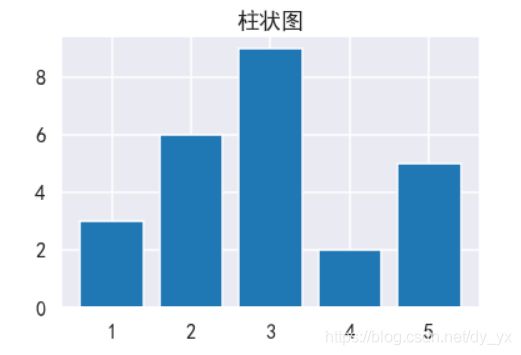
sns.set_style('darkgrid',{'font.sans-serif':['SimHei','Arial']})  #防止出现乱码,不添加这行,“柱状图”三个字就显示不出来
plt.bar([1,2,3,4,5],[3,6,9,2,5])
plt.title("柱状图")
sns.set_context("notebook")
plt.bar([1,2,3,4,5],[3,6,9,2,5])
plt.title("柱状图")
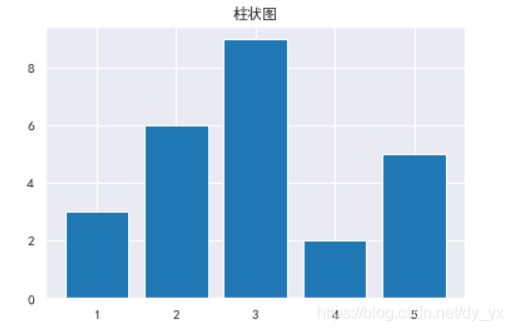
seaborn有四种预设,按相对尺寸的顺序(线条越来越粗)。
分别是paper,notebook, talk, and poster。
notebook的样式是默认的,上面的绘图都是使用默认的notebook预设。
Seaborn调色板
在seaborn中颜色主要分为连续渐变色板和离散分类色板。
分类色板,主要用color_palette()函数。
- color_palette()能传入任何Matplotlib所支持的颜色
- color_palette()不写参数则为默认颜色
- set_palette()设置所有图的颜色
6个默认的颜色循环主题: deep, muted, pastel, bright, dark, colorblind
#color_palette方法返回磨人的调色板信息
current_palette = sns.color_palette()
print(current_palette)
sns.palplot(current_palette)
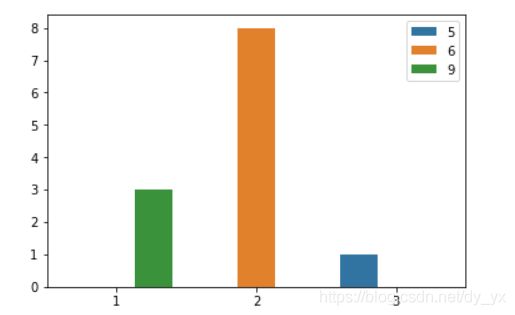
sns.barplot([1,2,3],[3,8,1],[9,6,5])
sns.palplot(sns.color_palette("deep"))
sns.palplot(sns.hls_palette(8 , l = .8, s = .5))
#l = 亮度
#s = 饱和度
#使用自定义颜色,构造颜色板
color=['red','orange','yellow','green','pink','blue','black',]
print(sns.color_palette(color))
sns.palplot(sns.color_palette(color))
#颜色渐变的调色板
sns.palplot(sns.color_palette("Blues"))#后面的颜色是可以自己调的
cubehelix_palette()
按照线性增长计算,设置颜色
sns.palplot(sns.cubehelix_palette(8, gamma = 2))
sns.palplot(sns.cubehelix_palette(8, start = .5, rot = -.75))
sns.palplot(sns.cubehelix_palette(8, start = 2, rot = 0, dark = 0, light = .95, reverse = True))
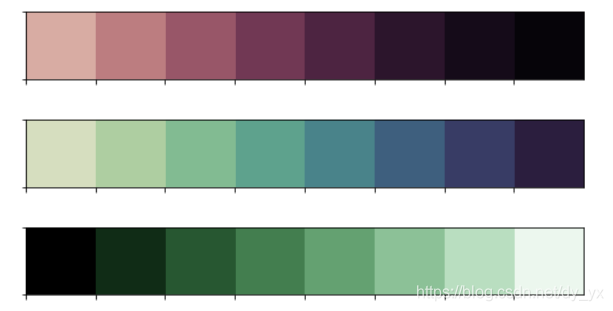 #n_colors—> 颜色个数
#start —> 值区间在0-3,开始颜色
#rot —> 颜色旋转角度
#gamma —> 颜色伽马值,越大颜色越暗
#dark,light —> 值区间0-1,颜色越深
#reverse —> 布尔值,默认为False,由浅到深
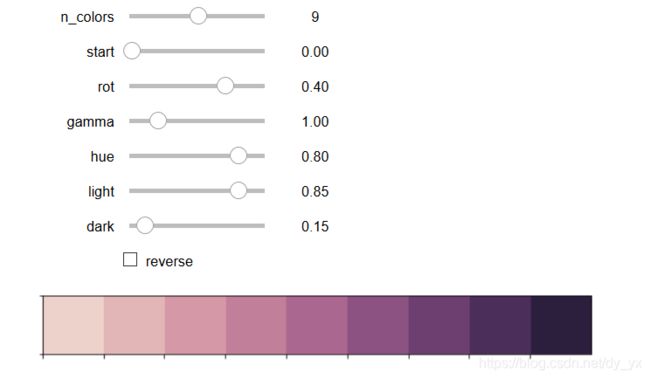
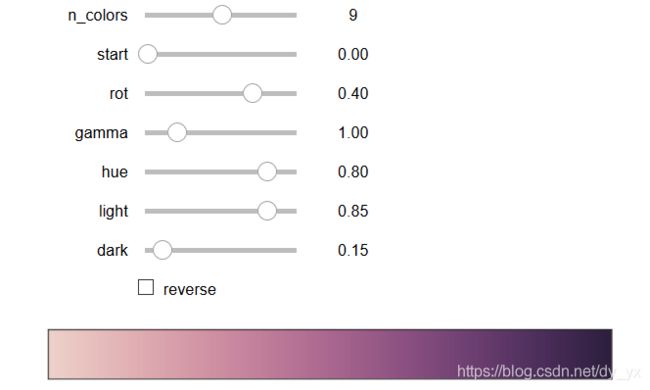
#一个交互式的方法
sns.choose_cubehelix_palette()
aa = sns.choose_cubehelix_palette(as_cmap=True)
