R语言--聚类分析
一、实验内容
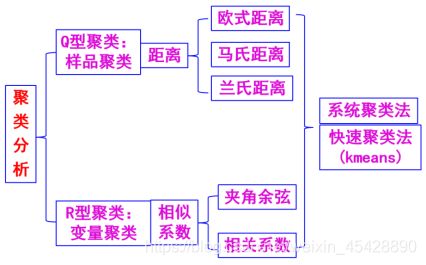
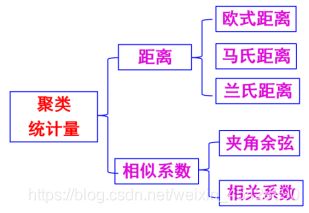
思想:研究样品或指标(变量)之间存在着程度不同的相似性(亲疏),并按相似程度不同将指标和样品形成一个分类系统。
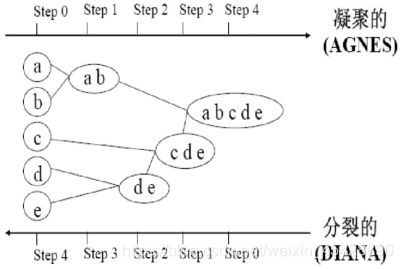
- 系统聚类
- Kmeans聚类

二、实验要求
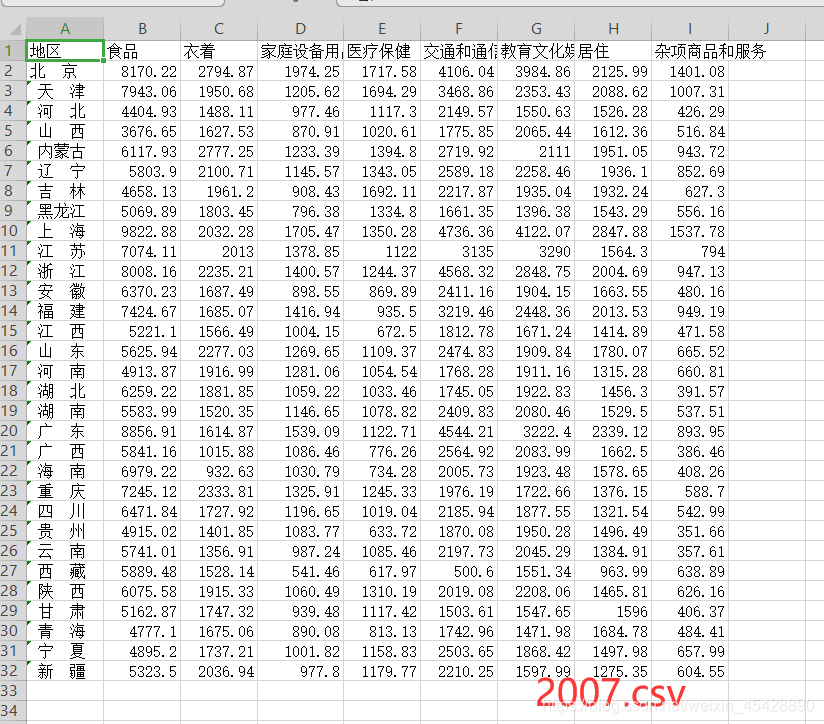
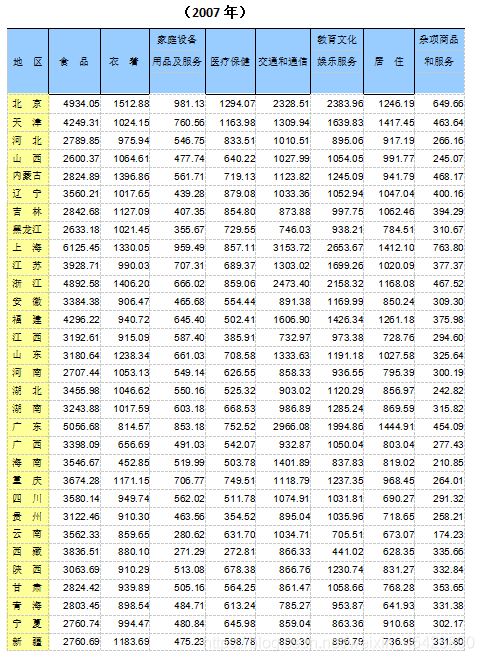
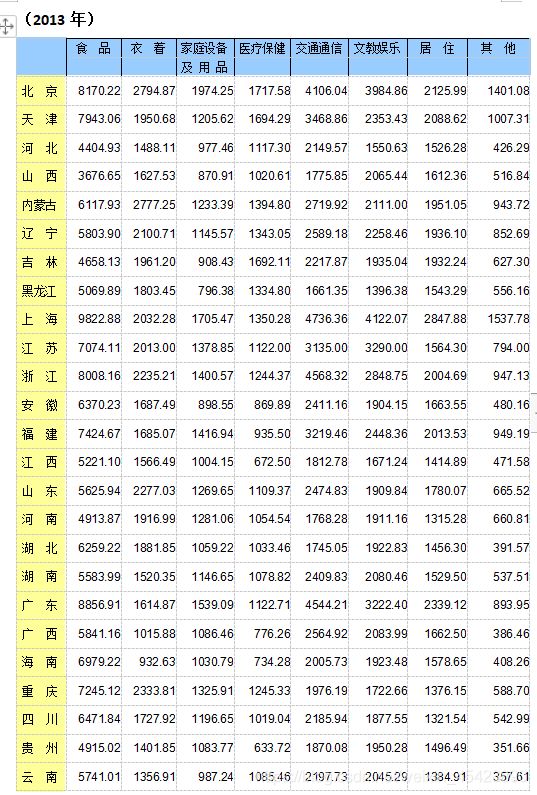
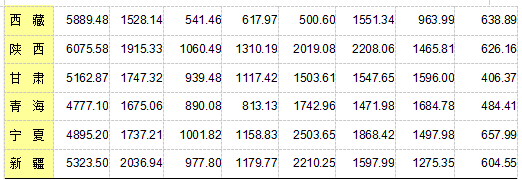
为了比较我国31个省、市、自治区2013年和2007年城镇居民生活消费的分布规律,根据调查资料作区域消费类型划分,并将2013年和2007你的数据进行对比分析,提交数据分析过程报告。今收集了八个反映城镇居民生活消费结构的指标(2013年数据)。
X1——人均食品支出(元/人);
X2——人均衣着商品支出(元/人);
X3——人均家庭设备用品及服务支出(元/人);
X4——人均医疗保健支出(元/人);
X5——人均交通和通信支出(元/人);
X6——人均娱乐教育文化服务支出(元/人);
X7——人均居住支出(元/人);
X8——人均杂项商品和服务支出(元/人)。
把城镇居民生活消费结构指标分为三类,“经济水平好”、“经济水平一般”、“经济水平较好”,最终比较2007年至2013年城镇居民生活消费结构指标的变化,并作出图标进行对比分析。
三、实验工具
R语言
分析
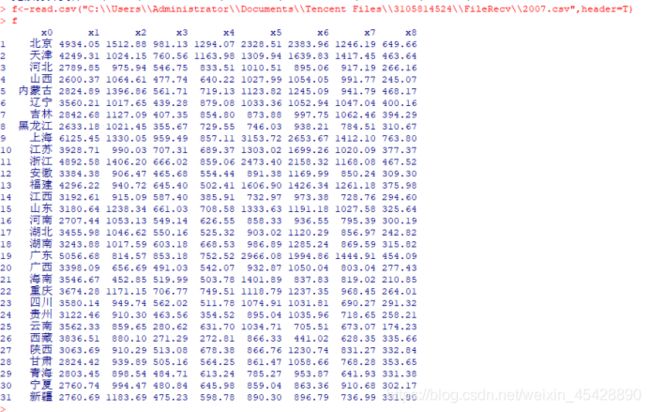
 f<-read.csv("2007.csv文件存放路径",header=T)  #读取数据
 f  #显示数据`
attach(f)
a<-f[,2:9]
y=scale(a)
cor(y)
pca=princomp(y,cor=FALSE,scores=TRUE)
summary(pca)

Comp1,comp2,comp3的累计方差贡献率达到90.4%,这部分承载了原数据绝大多数的信息。
Step4、做系统聚类
1)提取数据
a=cbind(f[,1],f[,2],f[,3])
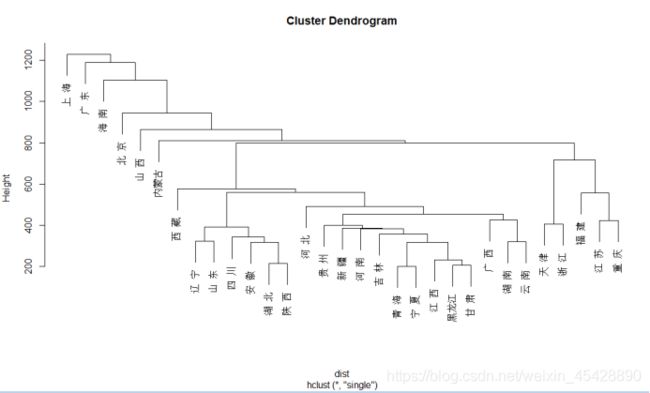
2)画聚类图
dist<-dist(a)
hc<-hclust(dist,"single")
cbind(hc$merge,hc$height)
plot(hc,f[,1])
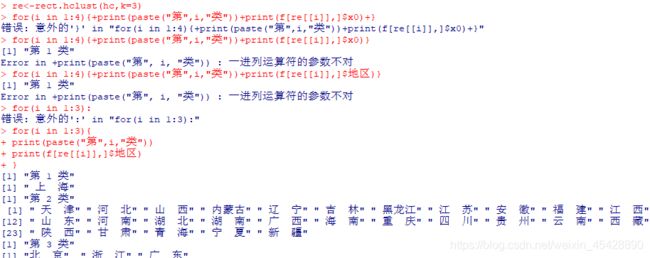
re<-rect.hclust(hc,k=3)
for(i in 1:3){
+print(paste("第",i,"类"))
+print(f[re[[i]],]$地区)
+}
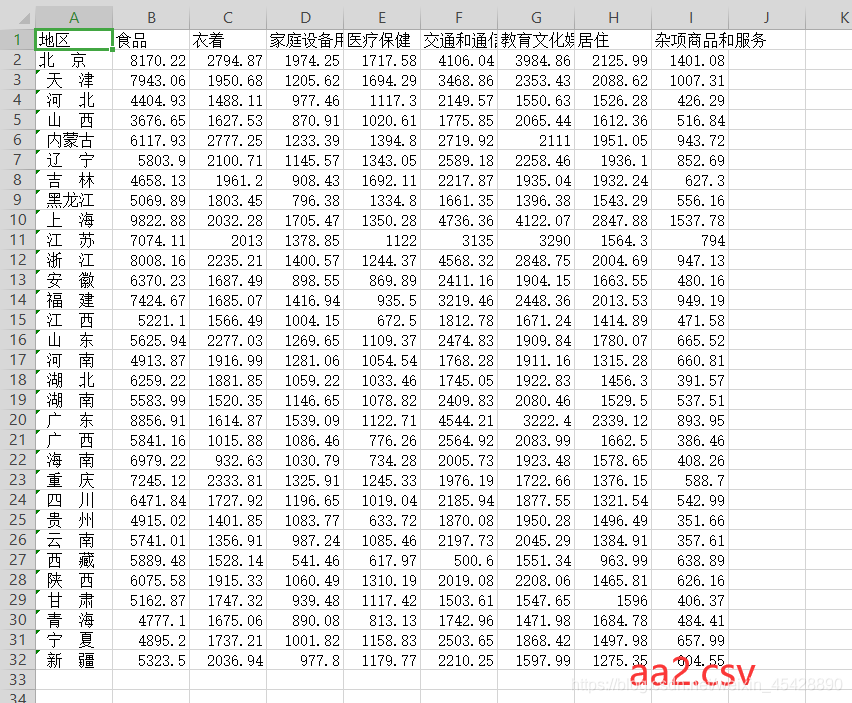
f<-read.csv("C:\\Users\\Adminstrator\\Documents\\Tencent Files\\3105814524\\FileRecv\\aa2.csv",header=T)  #读取数据
 f  #显示数据
attach(f)
a<-f[,2:9]
y=scale(a)
cor(y)
pca=princomp(y,cor=FALSE,scores=TRUE)
summary(pca)

Comp1,comp2,comp3的累计方差贡献率达到90.4%,这部分承载了原数据绝大多数的信息。
Step4、做系统聚类
1)提取数据
a=cbind(f[,1],f[,2],f[,3])
2)画聚类图
dist<-dist(a)
hc<-hclust(dist,"single")
cbind(hc$merge,hc$height)
plot(hc,f[,1])
re<-rect.hclust(hc,k=3)
for(i in 1;3):{
+print(paste("第",i,"类"))
+print(f[re[[i]],]$地区)
+}
