监控告警 Metrics - Prometheus
一.分布式系统关键技术: 监控
突发急诊
定位问题
应对突发流量
健康体检
容量管理
性能管理
监控是给开发人员一把测量反馈“尺”,要想提升,必须先要测量。意味着了解系统内部发生了什么,接收了多少流量,执行情况如何,有多少错误。但这不是最终目标,只是一种手段。我们的目标是能够检测、调试和解决出现的任何问题,而监视是该过程中不可缺少的一部分。
二.监控模式
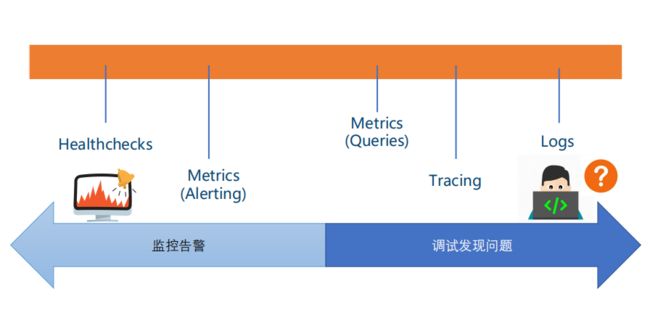
分类
Logging
记录离散事件的文本,可用于调试、分析、报告
好的日志是结构化的,方便处理
最常用
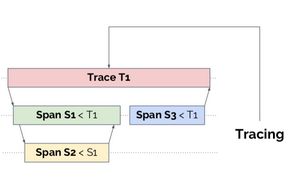
Tracing
跟踪处理所有请求范围内的性能数据
跟踪系统将元数据组织成树结构
Metrics
记录离散数据点
对重要数据点进行聚合运算,表现重要指标的趋势
Health checks
系统的健康检查
比较
CapEx:前期搭建所需的研发成本
OpEx:前期运维成本
Reaction:问题发生时的响应敏感度
Investigation:问题排查的有效程度
场景
三. Metrics
四个黄金指标
延迟:服务请求所需耗时 • 例如HTTP请求平均延迟
流量/吞吐:衡量服务容量需求 • 例如每秒处理HTTP请求数
错误:衡量错误发生的情况 • 例如HTTP 500错误数
饱和度:衡量资源使用情况 • 例如CPU/内存/磁盘使用量/队列/线程池
两类系统的监控
Online(应用、db、缓存系统等)
RED方法
Requests 请求数
Errors 错误数
Duration 延迟
Cache
命中率
Offline(Job,队列、线程池也可使用此方法)
USE方法
Utilization 利用率
Saturation 饱和度
Errors 错误数
job运行时长、成功/失败数
分层监控
经典架构模式
四. Prometheus
概述
背景:技术出现的背景、初衷
目标:要达到什么样的目标,或是要解决什么样的问题
优劣势:这个技术的优势和劣势分别是什么,或者说,这个技术的trade-off是什么
适用场景:业务场景,技术场景
核心组成及关键点:技术的核心思想和核心组件,学习技术的核心部分是快速掌握的关键
底层原理和关键实现:学习这些关键的基础底层技术,可以让你未来很快地掌握其它技术
对比:学习不同的实现,可以让你得到不同的想法和思路,对于开阔思维,深入细节是非常重要的
简介
开源监控工具(度量、告警,而非logging、tracing),最初由SoundCloud开发,源自google的borgmon
多维度数据模型,本质上是时间序列数据库(TSDB),主要是golang实现
PromQL,一种强大而灵活的查询语言
通过HTTP协议周期性抓取(pull模式)被监控组件的时序数据,任意组件只要提供对应的HTTP接口,就可以接入监控
黑盒&白盒监控都支持,DevOps友好
不依赖分布式存储,单个服务器节点是自治的,单机性能,每秒消费百万级时序数据,单节点可对接上千个target client
社区生态丰富(多语言、多exporters)
场景
适用
可以很好的记录纯数字的时间序列
既可以以机器为中心监控,也可以以动态的面向服务的体系结构进行监控,特别适用于微服务架构
prometheus服务是自治,可以不依赖于 网络存储 或 远程服务
不适用
100%的数据准确性要求,例如账单
因为收集的数据不够详细、完整
1.监控系统一般情况下可用性大于一致性,容忍部分副本数据丢失,保证查询请求成功;
2.针对rate、histogram_quantile 等函数会做统计和推断,不一定保证数据准确;
3.选取数据范围过大时,会减少采样,势必会造成数据精度丢失
对比
Zabbix |
Prometheus |
|
开发语言 |
后端用 C 开发,界面用 PHP 开发,定制化难度很高。 |
后端用 golang 开发,前端是 Grafana,JSON 编辑即可解决。定制化难度较低。 |
规模 |
集群规模上限为 10000 个节点。 |
支持更大的集群规模,速度也更快。 |
适用场景 |
更适合监控物理机环境。 |
更适合云环境的监控,对 Kubernetes 有更好的集成。 |
存储 |
监控数据存储在关系型数据库内,如 MySQL,很难从现有数据中扩展维度。 |
监控数据存储在基于时间序列的数据库内,便于对已有数据进行新的聚合。 |
集成使用 |
安装简单,zabbix-server 一个软件包中包括了所有的服务端功能。 |
安装相对复杂,监控、告警和界面都分属于不同的组件。 |
可视化配置 |
图形化界面比较成熟,界面上基本上能完成全部的配置操作。 |
界面相对较弱,很多配置需要修改配置文件。 |
成熟度 |
发展时间更长,对于很多监控场景,都有现成的解决方案。 |
2015 年后开始快速发展,但发展时间较短,成熟度不及 Zabbix。 |
总结 |
监控物理机、环境变动不频繁 或 有能力做各种定制时,zabbix |
刚上监控系统,云环境(环境变动频繁),prometheus |
一些指标数据
prometheus server 单机性能
每秒消耗百万级时间序列
上千个taget clients
对于taget client的影响
不同客户端库和语言的性能可能有所不同。
对于Java,基准测试表明,根据争用情况,用Java客户机递增计数器/测量将花费12-17ns。
这对于大多数延迟关键型代码来说是可以忽略的。
容量规划
磁盘
所需的磁盘容量(字节) = 时序数据保留时间(秒)* 每秒提取样本数量 * 每个样本的大小(字节)
内存
官方建议要预留3倍的local.memory-chunks的内存大小(local.memory-chunks = 内存里保存了最近使用的chunks ,默认值为1048576,即1048576个chunk,大小为1G)
核心组成及关键点
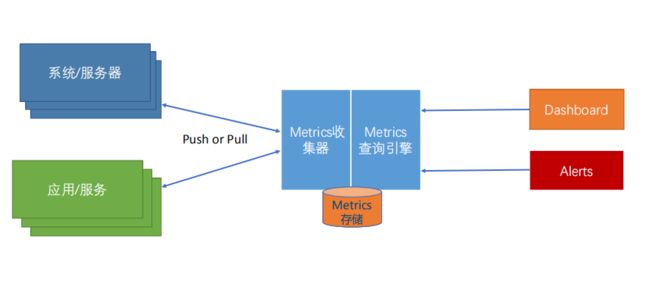
架构图
组件
必选
prometheus服务
抓取并存储时序数据
提供查询服务
触发告警
至少选一
数据采集组件
prometheus client libs(用于直接采集)
对产生数据的target client(应用)提供埋点开发的API,开发人员在业务代码自助埋点,API文档请点击对应语言查看
很多对prometheus友好的组件已经完成埋点,可直接在promethueus上配置使用
支持的Metrics类型
exporters(用于间接采集)
一些成熟的但不直接支持prometheus客户端埋点的产品(操作系统、redis等等),需要额外的工具进行黑盒采集,即使用exporter(独立于target client之外的“边车”)进行采集
当前已有三方exporter(https://prometheus.io/docs/instrumenting/exporters/)
OS – Node Exporter Linux, Windows
Database Mysql, Postgre, CouchDB…
Messaging Kafka, RabbitMQ, NATS…
LoggingElasticSearch, Fluentd, Telegraf…
Key-Value Redis, Memcached…
WebServer Apache, Nginx…
Proxy Haproxy, Varnish…
DNS BIND, PowerDNS, Unbound
BlackBox 暂时没有exporter方案的,可使用该方案,进行简单的ping
可选
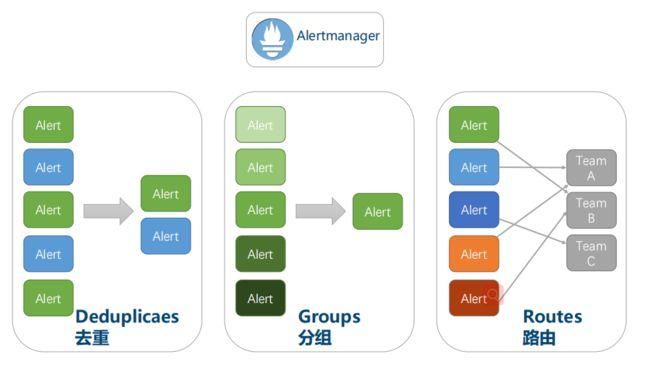
AlertManager
告警由prometheus内部监控、触发,之后传递给AlartManager
AlartManager负责去重、分组、路由
Pushgateway
有些作业存在的时间不长,因此这些作业可以主动的将它们的指标推(push)到Pushgateway,Pushgateway会将指标数据缓存
Pushgateway将收到的数据暴露给prometheus,prometheus定期到Pushgateway拉取(pull)
Pushgateway是针对服务级别(非机器指标)
各种支持工具(可视化、对接三方)
数据模型
api_http_requests_total {method="POST", handler="/messages"}  100
               {=, ...}   value
指标类型
拉取模式
https://blog.csdn.net/qq_35753140/article/details/105886208
Prometheus不是基于事件的监控系统,它仅仅关心标准化地采集给定指标的当前状态,而不是导致这些指标的底层事件。例如,计量服务不会发送关于每个HTTP请求的消息给Prometheus服务器,而是在内存中简单地累加这些请求。每秒可能会发生成百上千次这种累加而不会产生任何监控流量。Prometheus然后每隔15或30秒简单地问一下这个服务实例当前状态的累积值而已。监控结果的传输量很小,拉取模式也不会产生问题
数据查询-PromQL
PromQL是Prometheus查询语言。它支持广泛的操作,包括聚合、切片和切块、预测和连接。
求 HTTP错误百分比
PQL
sum(rate(http_requests_total{status="500"}[5m])) by (path) / sum(rate(http_requests_total[5m])) by (path)
查询结果
{path=“/status”} 0.0039
{path=“/”} 0.0011
{path=“/api/v1/topics/:topic”} 0.087
{path=“/api/v1/topics} 0.0342
4小时内磁盘是否会满
PQL
ALERT DiskWillFullIn4Hours IF predict_linear(node_filesystem_free[1h], 4*3600) < 0
查询结果
{path=“/status”} 0.0039
{path=“/”} 0.0011
{path=“/api/v1/topics/:topic”} 0.087
{path=“/api/v1/topics} 0.0342
实践
Prometheus client libs 进行 target 埋点
1. 运行模拟产生数据的程序http-simulator
以Spring Boot方式运行模拟器
通过
http://localhost:8080/prometheus查看metrics
通过Postman启用随机Spike模式,产生数据
curl -X POST http://localhost:8080/spike/random
2. 安装运行Promethus
下载Prometheus for Windows,并解压到本地目录
调整全配置项
# my global config
global:
  scrape_interval:     5s # Set the scrape interval to every 5 seconds. Default is every 1 minute.
  scrape_timeout: 5s
  evaluation_interval: 5s # Evaluate rules every 5 seconds. The default is every 1 minute.
添加http-simulator Job配置项
# A scrape configuration containing exactly one endpoint to scrape:
# Here it's Prometheus itself.
scrape_configs:
  # The job name is added as a label `job=` to any timeseries scraped from this config.
  - job_name: 'prometheus'

    # metrics_path defaults to '/metrics'
    # scheme defaults to 'http'.

    static_configs:
    - targets: ['localhost:9090']
  - job_name: 'http-simulator'
    metrics_path: /prometheus
    static_configs:
    - targets: ['localhost:8080']
运行Prometheus
./prometheus.exe
访问Prometheus Web UI
http://localhost:9090
通过Status->Targets,或者通过Graph查询
up
metric方式校验prometheus和http-simulator两个jobs在UP或1状态。
3. 请求率(Request Rate)查询
校验http-simulator在1状态
up{job="http-simulator"}
查询http请求数
http_requests_total{job="http-simulator"}
查询成功login请求数
http_requests_total{job="http-simulator", status="200", endpoint="/login"}
查询成功请求数,以endpoint区分
http_requests_total{job="http-simulator", status="200"}
查询总成功请求数
sum(http_requests_total{job="http-simulator", status="200"})
查询成功请求率,以endpoint区分
rate(http_requests_total{job="http-simulator", status="200"}[5m])
查询总成功请求率
sum(rate(http_requests_total{job="http-simulator", status="200"}[5m]))
4. 延迟分布(Latency distribution)查询
查询http-simulator延迟分布
http_request_duration_milliseconds_bucket{job="http-simulator"}
查询成功login延迟分布
http_request_duration_milliseconds_bucket{job="http-simulator", status="200", endpoint="/login"}
不超过200ms延迟的成功login请求占比
sum(http_request_duration_milliseconds_bucket{job="http-simulator", status="200", endpoint="/login", le="200.0"}) / sum(http_request_duration_milliseconds_count{job="http-simulator", status="200", endpoint="/login"})
成功login请求延迟的99百分位
histogram_quantile(0.99, rate(http_request_duration_milliseconds_bucket{job="http-simulator", status="200", endpoint="/login"}[5m]))
Prometheus + Grafana 进行数据展示
1. 先决条件
运行Prometheus HTTP Metrics Simulator
运行Prometheus服务器
2. 安装运行Grafana
下载Grafana 5.3.2 for Windows,并解压到本地目录。
运行:
./bin/grafana-server.exe
访问Granfa UI,使用缺省账号admin/admin登录
http://localhost:3000
添加Proemethes数据源
Name -> prom-datasource
Type -> Prometheus
HTTP URL -> http://localhost:9090
其它缺省
Save & Test确保连接成功
3. 创建一个Dashboard
点击+图标创建一个Dashbaord,点击保存图标保存Dashboard,使用缺省Folder,给Dashboard起名为prom-demo。
4. 展示请求率
点击Add panel图标,点击Graph图标添加一个Graph,
点击Graph上的Panel Title->Edit进行编辑
修改Title:General -> Title = Request Rate
设置Metrics
sum(rate(http_requests_total{job="http-simulator"}[5m]))
调整Lagend
以表格展示As Table
显示Min/Max/Avg/Current/Total
根据需要调整Axis
注意保存Dahsboard。
5. 展示实时错误率
点击Add panel图标,点击Singlestat图标添加一个Singlestat,
点击Graph上的Panel Title->Edit进行编辑
修改Title:General -> Title = Live Error Rate
设置Metrics
sum(rate(http_requests_total{job="http-simulator", status="500"}[5m])) / sum(rate(http_requests_total{job="http-simulator"}[5m]))
调整显示单位unit:Options->Unit,设置为None->percent(0.0-1.0)
调整显示值(目前为平均)为当前值(now):Options->Value->Stat,设置为Current
添加阀值和颜色:Options->Coloring,选中Value,将Threshold设置为0.01,0.05,表示
绿色:0-1%
橙色:1-5%
红色:>5%
添加测量仪效果:Options->Gauge,选中Show,并将Max设为1
添加错误率演变曲线:选中Spark lines -> Show
注意保存Dahsboard。
6. 展示Top requested端点
点击Add panel图标,点击Table图标添加一个Table,
设置Metrics
sum(rate(http_requests_total{job="http-simulator"}[5m])) by (endpoint)
减少表中数据项,在Metrics下,选中Instant只显示当前值
隐藏Time列,在Column Sytle下,Apply to columns named为Time,将Type->Type设置为Hidden
将Value列重命名,添加一个Column Style,Apply to columns named为Value,将Column Header设置为Requests/s
点击表中的Requests/s header,让其中数据根据端点活跃度进行排序。
注意调整Widget位置并保存Dahsboard。
Prometheus + AlertManager进行告警
1. 先决条件
运行Prometheus HTTP Metrics Simulator
运行Prometheus服务器
注意启用--web.enable-lifecycle,让Prometheus支持通过web端点动态更新配置
2. HttpSimulatorDown告警
在Prometheus目录下:
添加simulator_alert_rules.yml告警配置文件
groups:
- name: simulator-alert-rule
  rules:
  - alert: HttpSimulatorDown
    expr: sum(up{job="http-simulator"}) == 0
    for: 1m
    labels:
      severity: critical
修改prometheus.yml,引用simulator_alert_rules.yml文件
# Load rules once and periodically evaluate them according to the global 'evaluation_interval'.
rule_files:
  - "simulator_alert_rules.yml"
  # - "second_rules.yml"
通过Postman动态更新Prometheus配置
curl -X POST http://PROMETHEUS_URL:9090/-/reload
通过Prometheus->Status的Configuration和Rules确认配置和告警设置生效
关闭Prometheus HTTP Metrics Simulator应用,通过Prometheus->Alert界面上查看告警触发情况
3. ErrorRateHigh告警
已经完成的步骤2,则重新运行Prometheus HTTP Metrics Simulator
在simulator_alert_rules.yml文件中增加告警配置
 - alert: ErrorRateHigh
    expr: sum(rate(http_requests_total{job="http-simulator", status="500"}[5m])) / sum(rate(http_requests_total{job="http-simulator"}[5m])) > 0.02
    for: 1m
    labels:
      severity: major
    annotations:
      summary: "High Error Rate detected"
      description: "Error Rate is above 2% (current value is: {{ $value }}"
通过Postman动态更新Prometheus配置
curl -X POST http://PROMETHEUS_URL:9090/-/reload
通过Prometheus->Status的Configuration和Rules确认配置和告警设置生效
通过Postman调高HTTP Simulator的错误率到10%
curl -X POST http://localhost:8080/error_rate/10
通过Prometheus->Graph界面校验错误率上升
通过Prometheus->Alert界面校验查看触发情况
4. 安装和配置Alertmanager
下载Alertmanager for Windows,并解压到本地目录。
在Alertmanager目录下修改alertmanager.yml文件:
global:
  smtp_smarthost: 'smtp.163.com:25'
  smtp_from: '[email protected]'
  smtp_auth_username: '[email protected]'
  smtp_auth_password: 'xxxxx'

route:
  group_interval: 1m
  repeat_interval: 1m
  receiver: 'mail-receiver'
receivers:
- name: 'mail-receiver'
  email_configs:
    - to: '[email protected]'
启动Alertmanager
./alertmanager.exe
在Prometheus目录下,修改prometheus.yml配置Alertmanager地址
# Alertmanager configuration
alerting:
  alertmanagers:
  - static_configs:
    - targets:
      - localhost:9093
通过Postman动态更新Prometheus配置
curl -X POST http://PROMETHEUS_URL:9090/-/reload
通过Prometheus->Status的Configuration和Rules确认配置和告警设置生效
通过Alertmanager UI界面和设置的邮箱,校验ErrorRateHigh告警触发
Alertmanager UI访问地址:
http://localhost:9093
Prometheus + exportors + Grafana暴露target端点,使用grafana模板展示
1. 下载和运行wmi-exporter
下载wmi_exporter-amd64,并解压到本地目录
运行wmi-exporter
./wmi_exporter.exe校验metrics端点
http://localhost:9182/metrics2. 配置和运行Promethus
在Prometheus安装目录下
在prometheus.yml 中添加针对wmi-exporter的监控job
- job_name: 'wmi-exporter'
    static_configs:
- targets: ['localhost:9182']运行Prometheus
./prometheus.exe
访问Prometheus UI
http://localhost:9090通过Prometheus->Status的configuration和targets校验配置正确
通过Prometheus->Graph查询wmi-exporter在UP1状态
up{job="wmi-exporter"}3. Grafana Dashboard for wmi-exporter
在Grafana安装目录下启动Grafana服务器
./bin/grafana-server.exe
登录Grafana UI(admin/admin)
http://localhost:3000
通过Grafana的**+**图标导入(Import) wmi-exporter dashboard:
grafana id = 2129
注意选中
prometheus数据源
查看Windows Node dashboard。
4. 参考
Grafana Dashboard仓库
https://grafana.com/dashboards生产建议
单节点配置建议
Cardinality(基数)!!!
标签(label)的可能取值,就是Cardinality
每增加一个标签(label),就会产生一个时间序列
label过多,耗费存储
label过多,聚合计算耗时
一般建议每个实例的label数不大于10
安全
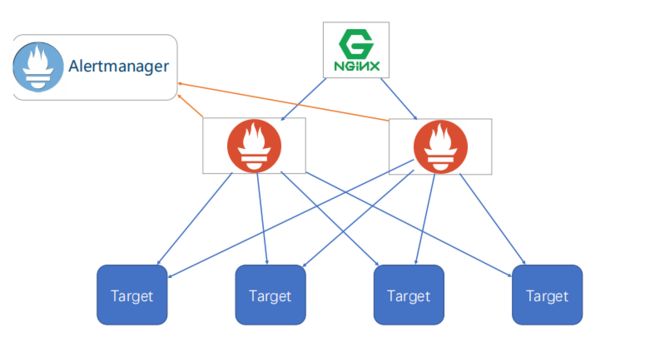
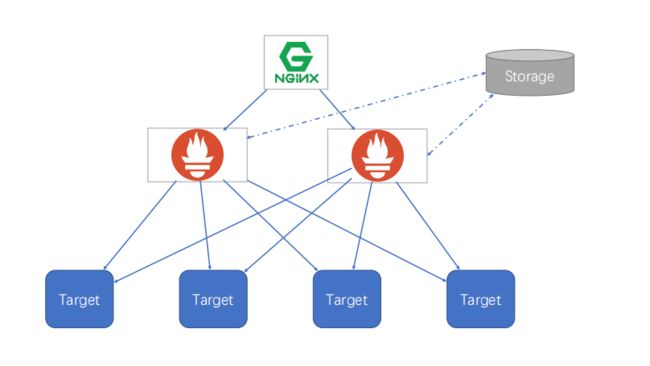
HA
简单HA
简单HA+远程存储
基本HA+远程存储+联邦集群
Metrics命名
一般建议:library_name_unit_suffix
_suffix
_total -> counter
_counter, _sum -> summary
_bucket -> histogram
_unit
_seconds, _bytes, _ratios
Name&Library
直接表意,例如A业务http请求 A_http_request_xxx,B业务http请求 B_http_request_xxx
source: https://www.yuque.com/zhaohaiyang/notes/gucm32
喜欢,在看

