【干货】pandas相关工具包
【干货】pandas相关工具包
公众号:ChallengeHub
1 Pandas 介绍
Pandas是python的一个数据分析包,最初由AQR Capital Management于2008年4月开发,并于2009年底开源出来,目前由专注于Python数据包开发的PyData开发team继续开发和维护,属于PyData项目的一部分。Pandas最初被作为金融数据分析工具而开发出来,因此,pandas为时间序列分析提供了很好的支持。Pandas的名称来自于面板数据(panel data)和python数据分析(data analysis)。panel data是经济学中关于多维数据集的一个术语,在Pandas中也提供了panel的数据类型。
Pandas用于广泛的领域,包括金融,经济,统计,分析等学术和商业领域。在本教程中,我们将学习Python Pandas的各种功能以及如何在实践中使用它们。
2 Pandas 主要特点
- 快速高效的DataFrame对象,具有默认和自定义的索引。
- 将数据从不同文件格式加载到内存中的数据对象的工具。
- 丢失数据的数据对齐和综合处理。
- 重组和摆动日期集。
- 基于标签的切片,索引和大数据集的子集。
- 可以删除或插入来自数据结构的列。
- 按数据分组进行聚合和转换。
- 高性能合并和数据加入。
- 时间序列功能。
3 Pandas 数据结构
- Series:一维数组,与Numpy中的一维array类似,二者与Python基本的数据结构List也很相近。Series如今能保存不同种数据类型,字符串、boolean值、数字等。
- Time-Series:以时间为索引的Series。
- DataFrame:二维的表格型数据结构,很多功能与R中的data.frame类似,可以将DataFrame理解为Series的容器。
- Panel :三维数组,可以理解为DataFrame的容器。
如果大家对pandas陌生的话,可以随便百度,google相关例子,每日练习即可。下面是本篇文章的主要介绍的内容,就是有关在日常使用提高效率的pandas相关的工具包
4 pandas-profiling
从pandas DataFrame对象中创建HTML形式的分析报告
官方链接:https://github.com/pandas-profiling/pandas-profiling

4.1 安装命令
pip install pandas-profiling[notebook]
4.2 简单实例
生成一个DataFrame
import numpy as np
import pandas as pd
from pandas_profiling import ProfileReport

df = pd.DataFrame(
    np.random.rand(100, 5),
    columns=["a", "b", "c", "d", "e"]
)
生成分析报告
profile = ProfileReport(df, title="Pandas Profiling Report")
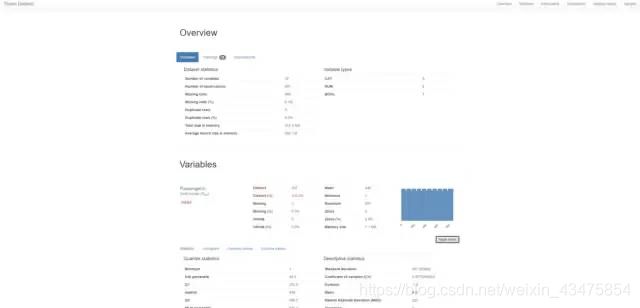
大家可以观摩下pandas_profiling 在Titanic Dataset数据上生成的数据分析报告,真的很强大!

具体报告在:https://pandas-profiling.github.io/pandas-profiling/examples/master/titanic/titanic_report.html
更多例子以及使用方法请参照官方链接,刚开一展身手吧~
5 missingno
数据集非常混乱?含有缺失值?missingno提供了一组灵活且易于使用的缺失数据可视化工具和实用程序,使开发者能够快速地可视化总结数据集的完整性(或缺失性)。
官方链接:https://github.com/ResidentMario/missingno
5.1 安装命令
直接通过pip即可安装
pip install missingno
5.2 简单实例
通过quilt来下载案例数据
$ pip install quilt
$ quilt install ResidentMario/missingno_data
然后加载数据
>>> from quilt.data.ResidentMario import missingno_data
>>> collisions = missingno_data.nyc_collision_factors()
>>> collisions = collisions.replace("nan", np.nan)
分析缺失值分布
>>> import missingno as msno
>>> %matplotlib inline
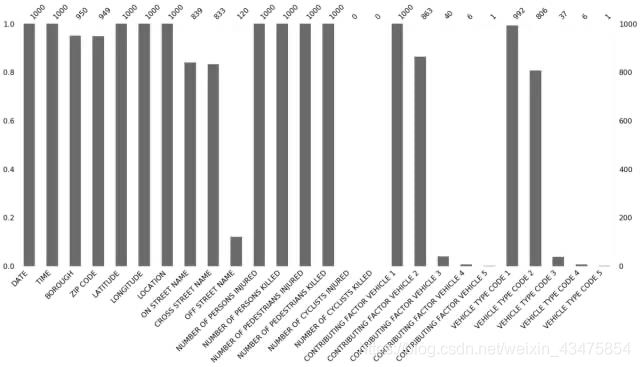
>>> msno.bar(collisions.sample(1000))
缺失值比例

6 swifter
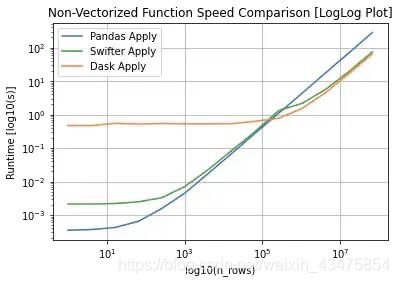
加速panda的DataFrame或Series的apply任何函数的运算工具包。

官方链接:https://github.com/jmcarpenter2/swifter
6.1 安装命令
$ pip install -U pandas # upgrade pandas
$ pip install swifter # first time installation
$ pip install -U swifter # upgrade to latest version if already installed
6.2 简单实例
df = pd.DataFrame({'x': [1, 2, 3, 4], 'y': [5, 6, 7, 8]})
# runs on single core
df['x2'] = df['x'].apply(lambda x: x**2)
# runs on multiple cores
df['x2'] = df['x'].swifter.apply(lambda x: x**2)

# use swifter apply on whole dataframe
df['agg'] = df.swifter.apply(lambda x: x.sum() - x.min())

# use swifter apply on specific columns
df['outCol'] = df[['inCol1', 'inCol2']].swifter.apply(my_func)
df['outCol'] = df[['inCol1', 'inCol2', 'inCol3']].swifter.apply(my_func,
             positional_arg, keyword_arg=keyword_argval)
7 pandarallel
一个简单高效的pandas运算工具,然cpu烧起来吧!

官方链接:https://github.com/nalepae/pandarallel
7.1 安装命令
$ pip install pandarallel [--upgrade] [--user]
7.2 使用方法
Without parallelization	With parallelization
df.apply(func)	df.parallel_apply(func)
df.applymap(func)	df.parallel_applymap(func)
df.groupby(args).apply(func)	df.groupby(args).parallel_apply(func)
df.groupby(args1).col_name.rolling(args2).apply(func)	df.groupby(args1).col_name.rolling(args2).parallel_apply(func)
df.groupby(args1).col_name.expanding(args2).apply(func)	df.groupby(args1).col_name.expanding(args2).parallel_apply(func)
series.map(func)	series.parallel_map(func)
series.apply(func)	series.parallel_apply(func)
series.rolling(args).apply(func)	series.rolling(args).parallel_apply(func)
8 pytablewriter
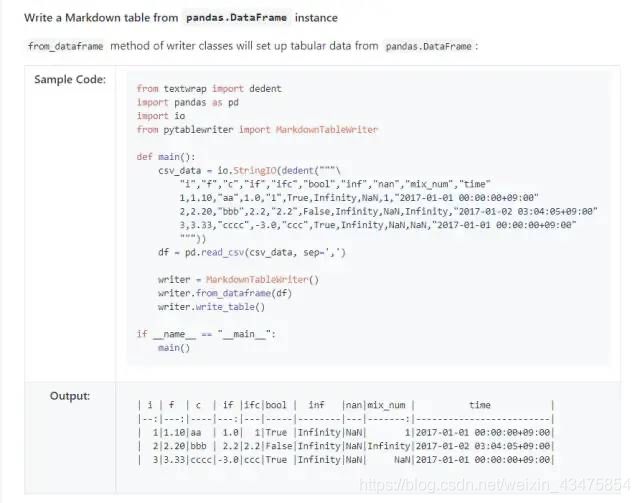
pandas输出格式化工具:CSV / Elasticsearch / HTML / JavaScript / JSON / LaTeX / LDJSON / LTSV / Markdown / MediaWiki / NumPy / Excel / Pandas / Python / reStructuredText / SQLite / TOML / TSV / YAML.

官方链接:https://github.com/thombashi/pytablewriter#installation-pip
8.1 安装命令
pip install pytablewriter
8.2 实例
from textwrap import dedent
import pandas as pd
import io
from pytablewriter import MarkdownTableWriter

def main():
    csv_data = io.StringIO(dedent("""\
        "i","f","c","if","ifc","bool","inf","nan","mix_num","time"
        1,1.10,"aa",1.0,"1",True,Infinity,NaN,1,"2017-01-01 00:00:00+09:00"
        2,2.20,"bbb",2.2,"2.2",False,Infinity,NaN,Infinity,"2017-01-02 03:04:05+09:00"
        3,3.33,"cccc",-3.0,"ccc",True,Infinity,NaN,NaN,"2017-01-01 00:00:00+09:00"
        """))
    df = pd.read_csv(csv_data, sep=',')

    writer = MarkdownTableWriter()
    writer.from_dataframe(df)
    writer.write_table()

if __name__ == "__main__":
    main()
9 参考资料
pandas简介
https://geek-docs.com/pandas/pandas-tutorials/pandas-introduction.html

