通过成绩来做人员分类 by K-均值聚类
项目背景:通过两种成绩的特征来做人员分类。
K-均值聚类算法
聚类是一种无监督的学习,它将相似的对象归到同一簇中,类似全自动分类。簇内的对象越相似,聚类的效果越好。K-均值聚类是每个类别簇都是采用簇中所含值的均值计算而成。聚类与分类的区别在于分类前目标已知,而聚类为无监督分类。
# kMeans.py
import kMeans

# 加载数据
score_excel = pd.read_excel('0803-np.xlsx')
score_excel = score_excel.values
datMat = mat(score_excel)
datMat[:5]
#matrix([[575,   0],
#        [570, 380],
#        [640, 640],
#        [600,   0],
#        [450,   0]], dtype=int64)

# 运用kMeans算法
myCentroids, clustAssing = kMeans.kMeans(datMat,4)

# 中心点
myCentroids
#matrix([[355.73076923, 325.83216783],
#        [510.49382716,   6.66666667],
#        [511.13912515, 483.11968408],
#        [689.26038501, 672.38095238]])

# 聚类信息
clustAssing[:5]
#matrix([[1.00000000e+00, 4.20549078e+03],
#        [2.00000000e+00, 1.40982718e+04],
#        [3.00000000e+00, 3.47511161e+03],
#        [1.00000000e+00, 8.05579942e+03],
#        [1.00000000e+00, 3.70394757e+03]])

# 绘制散点图
point_x = array(datMat[:,0])
point_y = array(datMat[:,1])
Centroid_x = array(myCentroids[:,0])
Centroid_y = array(myCentroids[:,1])
fig, ax = plt.subplots(figsize=(10,5))
colors = array(clustAssing[:,0])
ax.scatter(point_x, point_y, s=30, c=colors, marker="o")
ax.scatter(Centroid_x,Centroid_y, s=300, c="b", marker="+", label="Centroid")
ax.legend()
ax.set_xlabel("factor1")
ax.set_ylabel("factor2")
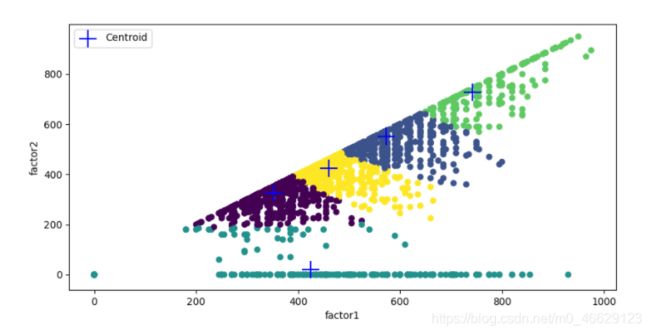
二分K-均值算法
二分K-均值类似后处理的切分思想,初始状态所有数据点属于一个大簇,之后每次选择一个簇切分成两个簇,这个切分满足使SSE值最大程度降低,直到簇数目达到k。另一种思路是每次选择SSE值最大的一个簇进行切分。
# 加载数据
score_excel = pd.read_excel('0803-np.xlsx')
score_excel = score_excel.values
datMat3 = mat(score_excel)
datMat3[:5]
#matrix([[575,   0],
#        [570, 380],
#        [640, 640],
#        [600,   0],
#        [450,   0]], dtype=int64)

# 运用二分K-均值算法
centList,myNewAssments = kMeans.biKmeans(datMat3,5)
#sseSplit, and notSplit:  105513429.68112904 0.0
#the bestCentToSplit is:  0
#the len of bestClustAss is:  4306
#sseSplit, and notSplit:  36134251.50003529 35031776.51024811
#sseSplit, and notSplit:  12083320.072324853 70481653.17088091
#the bestCentToSplit is:  0
#the len of bestClustAss is:  2452
#sseSplit, and notSplit:  8576088.302848985 50961376.18870471
#sseSplit, and notSplit:  11915741.730850179 36134251.50003529
#sseSplit, and notSplit:  6293690.402928098 55236428.33182681
#the bestCentToSplit is:  1
#the len of bestClustAss is:  1854
#sseSplit, and notSplit:  8672487.587634712 27845341.409306772
#sseSplit, and notSplit:  3120568.753164704 40922593.45936985
#sseSplit, and notSplit:  6293690.402928098 32120393.55242888
#sseSplit, and notSplit:  1737595.391875223 43261651.27155091
#the bestCentToSplit is:  0
#the len of bestClustAss is:  2141

# 中心点
centList
#matrix([[352.3627907 , 325.26511628],
#        [572.77227723, 550.57501904],
#        [424.59807074,  20.01607717],
#        [742.22735675, 728.39186691],
#        [459.61069418, 425.48311445]])

# 聚类信息
myNewAssments[:5]
#matrix([[2.00000000e+00, 2.30213837e+04],
#        [4.00000000e+00, 1.42545125e+04],
#        [1.00000000e+00, 1.25163939e+04],
#        [2.00000000e+00, 3.11664801e+04],
#        [2.00000000e+00, 1.04590136e+03]])

# 绘制散点图
point_x = array(datMat3[:,0])
point_y = array(datMat3[:,1])
Centroid_x = array(centList[:,0])
Centroid_y = array(centList[:,1])
fig, ax = plt.subplots(figsize=(10,5))
colors = array(myNewAssments[:,0])
ax.scatter(point_x, point_y, s=30, c=colors, marker="o")
ax.scatter(Centroid_x,Centroid_y, s=300, c="b", marker="+", label="Centroid")
ax.legend()
ax.set_xlabel("factor1")
ax.set_ylabel("factor2")
kMeans.py
from numpy import *
import numpy as np

def loadDataSet(fileName):      #general function to parse tab -delimited floats
    dataMat = []                #assume last column is target value
    fr = open(fileName)
    for line in fr.readlines():
        curLine = line.strip().split('\t')
        fltLine = list(map(float,curLine)) #map all elements to float()
        dataMat.append(fltLine)
    return dataMat

def distEclud(vecA, vecB):
    return sqrt(sum(power(vecA - vecB, 2))) #la.norm(vecA-vecB)

#def randCent(data_set, k):
#    n = data_set.shape[1]
#    centroids = np.zeros((k, n))
#    for j in range(n):
#        min_j = float(min(data_set[:,j]))
#        range_j = float(max(data_set[:,j])) - min_j
#        centroids[:,j] = (min_j + range_j * np.random.rand(k, 1))[:,0]
#    return centroids


def randCent(dataSet, k):
    n = shape(dataSet)[1]
    centroids = mat(zeros((k,n)))#create centroid mat
    for j in range(n):#create random cluster centers, within bounds of each dimension
        #minJ = min(dataSet[:,j])
        #rangeJ = float(max(dataSet[:,j]) - minJ)
        minJ = float(min(dataSet[:,j]))
        rangeJ = float(max(dataSet[:,j]))- minJ
        centroids[:,j] = mat(minJ + rangeJ * random.rand(k,1))
    return centroids


def kMeans(dataSet, k, distMeas=distEclud, createCent=randCent):
    m = shape(dataSet)[0]
    clusterAssment = mat(zeros((m,2)))#create mat to assign data points
                                      #to a centroid, also holds SE of each point
    centroids = createCent(dataSet, k)
    clusterChanged = True
    while clusterChanged:
        clusterChanged = False
        for i in range(m):#for each data point assign it to the closest centroid
            minDist = inf; minIndex = -1
            for j in range(k):
                distJI = distMeas(centroids[j,:],dataSet[i,:])
                if distJI < minDist:
                    minDist = distJI; minIndex = j
            if clusterAssment[i,0] != minIndex: clusterChanged = True
            clusterAssment[i,:] = minIndex,minDist**2
        #print (centroids)
        for cent in range(k):#recalculate centroids
            ptsInClust = dataSet[nonzero(clusterAssment[:,0].A==cent)[0]]#get all the point in this cluster
            centroids[cent,:] = mean(ptsInClust, axis=0) #assign centroid to mean
    return centroids, clusterAssment

def biKmeans(dataSet, k, distMeas=distEclud):
    m = shape(dataSet)[0]
    clusterAssment = mat(zeros((m,2)))
    centroid0 = mean(dataSet, axis=0).tolist()[0]
    centList =[centroid0] #create a list with one centroid
    for j in range(m):#calc initial Error
        clusterAssment[j,1] = distMeas(mat(centroid0), dataSet[j,:])**2
    while (len(centList) < k):
        lowestSSE = inf
        for i in range(len(centList)):
            ptsInCurrCluster = dataSet[nonzero(clusterAssment[:,0].A==i)[0],:]#get the data points currently in cluster i
            centroidMat, splitClustAss = kMeans(ptsInCurrCluster, 2, distMeas)
            sseSplit = sum(splitClustAss[:,1])#compare the SSE to the currrent minimum
            sseNotSplit = sum(clusterAssment[nonzero(clusterAssment[:,0].A!=i)[0],1])
            print ("sseSplit, and notSplit: ",sseSplit,sseNotSplit)
            if (sseSplit + sseNotSplit) < lowestSSE:
                bestCentToSplit = i
                bestNewCents = centroidMat
                bestClustAss = splitClustAss.copy()
                lowestSSE = sseSplit + sseNotSplit
        bestClustAss[nonzero(bestClustAss[:,0].A == 1)[0],0] = len(centList) #change 1 to 3,4, or whatever
        bestClustAss[nonzero(bestClustAss[:,0].A == 0)[0],0] = bestCentToSplit
        print ('the bestCentToSplit is: ',bestCentToSplit)
        print ('the len of bestClustAss is: ', len(bestClustAss))
        centList[bestCentToSplit] = bestNewCents[0,:].tolist()[0]#replace a centroid with two best centroids
        centList.append(bestNewCents[1,:].tolist()[0])
        clusterAssment[nonzero(clusterAssment[:,0].A == bestCentToSplit)[0],:]= bestClustAss#reassign new clusters, and SSE
    return mat(centList), clusterAssment

