ccc-sklearn-12-线性回归(2)
一、非线性问题:多项式回归
主要探讨:通过线性回归解决非线性问题
数据的线性与非线性
通常情况下,分类问题中决策函数往往是一个分段函数,这个函数明显不满足可以用一条直线进行表示的属性,因此分类问题中特征与标签[0,1]或者[-1,1]之间关系明显是非线性的。需要注意的是,回归图像绘制时,横坐标的特征,纵坐标是标签;分类中,横坐标与纵坐标分别是2个特征,前者数据分布若能为一条直线,则是线性的,后者若分布能使用一条直线来划分类别则是线性可分的
线性模型与非线性模型
回归中,线性数据可以使用如下的方程进行拟合:
y = w 0 + w 1 x 1 + w 2 x 2 + w 3 x 3 + . . . w n x n y=w_0+w_1x_1+w_2x_2+w_3x_3+...w_nx_n y=w0+w1x1+w2x2+w3x3+...wnxn
这就是线性回归的方程,根据线性回归的方程可以拟合一组参数w从而建立一个线性回归模型。可以看到线性模型的一个特点:自变量都是一次项
建立一个明显非线性数据观察线性回归和决策树在拟合时的表现:
数据准备:
import numpy as np
import matplotlib.pyplot as plt
from sklearn.linear_model import LinearRegression
from sklearn.tree import DecisionTreeRegressor

rnd = np.random.RandomState(42)
X = rnd.uniform(-3,3,size=100)

y = np.sin(X) + rnd.normal(size=len(X))/3
plt.scatter(X,y,marker='o',c='k',s=20)
plt.show()
X.shape
#sklearn只能接受二维以上作为特征矩阵的输入
X = X.reshape(-1,1)
LinearR = LinearRegression().fit(X,y)
TreeR = DecisionTreeRegressor(random_state=0).fit(X,y)
fig,ax1 = plt.subplots(1)
line = np.linspace(-3,3,1000,endpoint=False).reshape(-1,1)
ax1.plot(line,LinearR.predict(line),linewidth=2,color='green',label="linear regression")
ax1.plot(line,TreeR.predict(line),linewidth=2,color='red',label='decision tree')
ax1.plot(X[:,0],y,'o',c='k')
ax1.legend(loc="best")
ax1.set_ylabel("Regression output")
ax1.set_xlabel("Input feature")
ax1.set_title("Result before discretization")
plt.tight_layout()
plt.show()

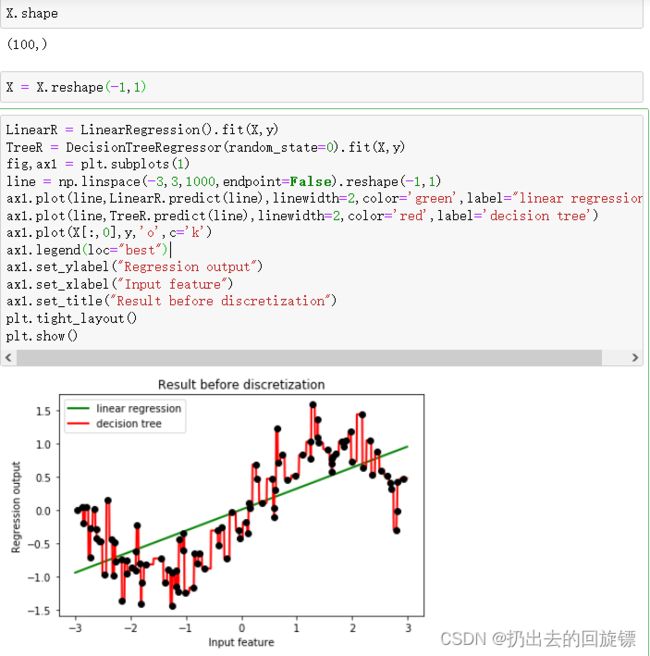
可以看到,线性回归基本上无法拟合正弦曲线,而决策树又明显过拟合。实际上,机器学习中线性模型也可以用来拟合非线性数据,非线性模型也可以用来拟合线性数据,接下来将一一探讨
- 非线性模型拟合线性数据

线性数据对于非线性模型来说太简单,很容易导致训练集上 R 2 R^2 R2训练的很高,MSE训练的很低 - 线性模型拟合非线性数据

一般用线性模型拟合非线性数据或者对非线性数据可分的数据进行分类,通常表现都很差。通常可以通过分箱的方式改善线性模型在非线性数据上的表现。线性模型的决策边界是平行的直线,而非线性模型的决策边界通常是曲线或者交叉的直线;对分类问题而言,如果一个分类模型的决策边界上自变量的最高次方为1,则称这个模型是线性模型 - 还有即支持线性和非线性模型的支持向量机,不进行建模的KNN等
| 线性模型 | 非线性模型 | |
|---|---|---|
| 代表模型 | 线性回归,逻辑回归,弹性网,感知机 | 决策树,树的集成模型,使用高斯核的SVM |
| 模型特点 | 模型简单,运行速度快 | 模型复杂,效果好,但速度慢 |
| 数学特征:回归 | 自变量是一次项 | 自变量不都是一次项 |
| 分类 | 决策边界上的自变量都是一次项 | 决策边界上的自变量不都是一次项 |
| 可视化: 回归 | 拟合出的图像是一条直线 | 拟合出的图像不是一条直线 |
| 分类 | 决策边界在二维平面是一条直线 | 决策边界在二维平面不是一条直线 |
| 擅长数据类型 | 主要是线性数据,线性可分数据 | 所有数据 |
二、使用分箱处理非线性问题
分箱也就是离散化,数据准备和处理和上一节相同
使用分箱进行建模和绘图
from sklearn.preprocessing import KBinsDiscretizer
enc = KBinsDiscretizer(n_bins=10,encode="onehot")
X_binned = enc.fit_transform(X)
line_binned = enc.fit_transform(line)
import pandas as pd
pd.DataFrame(X_binned.toarray()).head()

fig,(ax1,ax2) = plt.subplots(ncols=2,sharey=True,figsize=(10,4))

ax1.plot(line,LinearR.predict(line),linewidth=2,color='green',label="linear regression")
ax1.plot(line,TreeR.predict(line),linewidth=2,color='red',label='decision tree')
ax1.plot(X[:,0],y,'o',c='k')
ax1.legend(loc="best")
ax1.set_ylabel("Regression output")
ax1.set_xlabel("Input feature")
ax1.set_title("Result before discretization")
LinearR_ = LinearRegression().fit(X_binned,y)
TreeR_ = DecisionTreeRegressor(random_state=0).fit(X_binned,y)

ax2.plot(line,
        LinearR_.predict(line_binned),
        linewidth=2,
        color='green',
        label='linear regression')
ax2.plot(line,TreeR_.predict(line_binned),linewidth=2,color='red',
        linestyle=':',label='decision tree')
ax2.vlines(enc.bin_edges_[0],
          *plt.gca().get_ylim(),
          linewidth=1,alpha=.2)
ax2.plot(X[:,0],y,'o',c='k')
ax2.legend(loc="best")
ax2.set_xlabel("Input feature")
ax2.set_title("Result after discretization")
plt.tight_layout()
plt.show()

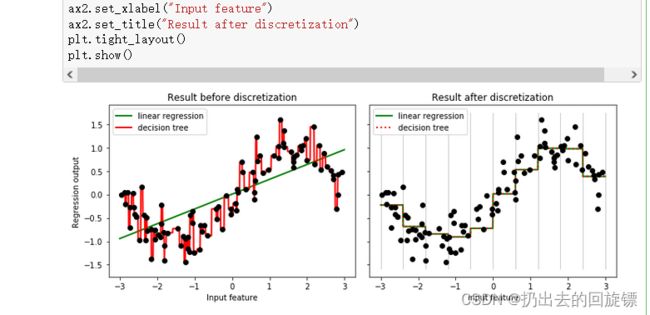
图像上可以看出,离散后线性回归和决策树预测相一致,也缓解了过拟合现象。当然,一般不使用分箱解决过拟合问题,因为树模型自身带有丰富有效的剪枝功能来防止
箱子数量对于模型结果的影响以及选取最优箱子数
enc = KBinsDiscretizer(n_bins=5,encode="onehot")
X_binned = enc.fit_transform(X)
line_binned = enc.fit_transform(line)

fig,ax2 = plt.subplots(1,figsize=(5,4))
LinearR_ = LinearRegression().fit(X_binned,y)
TreeR_ = DecisionTreeRegressor(random_state=0).fit(X_binned,y)
ax2.plot(line,
        LinearR_.predict(line_binned),
        linewidth=2,
        color='green',
        label='linear regression')
ax2.plot(line,
        TreeR_.predict(line_binned),linewidth=2,color='red',
        linestyle=':',label='decision tree')
ax2.vlines(enc.bin_edges_[0],
          *plt.gca().get_ylim(),
          linewidth=1,alpha=.2)
ax2.plot(X[:,0],y,'o',c='k')
ax2.legend(loc="best")
ax2.set_xlabel("Input feature")
ax2.set_title("Result after discretization")
plt.tight_layout()
plt.show()

曲线拟合更加宽泛,理所当然的拟合效果没那么好,分箱会导致过拟合
from sklearn.model_selection import cross_val_score as CVS
import numpy as np
pred,score,var = [],[],[]
binsrange = [2,5,10,15,20,30]
for i in binsrange:
    enc = KBinsDiscretizer(n_bins=i,encode="onehot")
    X_binned = enc.fit_transform(X)
    line_binned = enc.fit_transform(line)
    LinearR_ = LinearRegression()
    cvresult = CVS(LinearR_,X_binned,y,cv=5)
    score.append(cvresult.mean())
    var.append(cvresult.var())
    pred.append(LinearR_.fit(X_binned,y).score(line_binned,np.sin(line)))

plt.figure(figsize=(6,5))
plt.plot(binsrange,pred,c="orange",label="test")
plt.plot(binsrange,score,c="k",label="full data")
plt.plot(binsrange,score+np.array(var)*0.5,c="red",linestyle="--",label="var")
plt.plot(binsrange,score-np.array(var)*0.5,c="red",linestyle="--")
plt.legend()
plt.show()

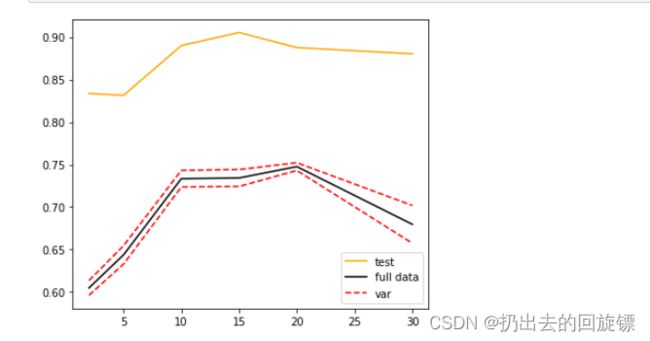
尽管测试数据和全数据集的分数不同,但总体趋势相似。如今工业场景中使用大量离散化特征的情况已经不多见了。
多项式回归PolynomialFeatures

线性模型中升维工具就是多项式变化。通过自变量上次数的增加,将数据映射到高维空间的方法


不难看出规律总结

这个规律在转换为二次多项式时同样适用。原本模型应该是形似直线方程的结构,升维后可以继续适用线性回归来进行拟合出如下的模型:
y = w 0 x 0 + w 1 x + w 2 x 2 + w 3 x 3 y=w_0x_0+w_1x+w_2x^2+w3x^3 y=w0x0+w1x+w2x2+w3x3
由此推断,假设多项式转化的次数是n,则数据会被转化成形如:
[ 1 , x , x 2 , x 3 . . . . x n ] [1,x,x^2,x^3....x^n] [1,x,x2,x3....xn]
拟合的方程为
y = w 0 x 0 + w 1 x + w 2 x 2 + w 3 x 3 . . . . . w n x n , ( x 0 = 1 ) y=w_0x_0+w_1x+w_2x^2+w3x^3.....w_nx^n,(x_0=1) y=w0x0+w1x+w2x2+w3x3.....wnxn,(x0=1)
当原始特征矩阵是二维时:

有如下规律:

得到如下方程:

同理,三次多项式会得到这样的规律:

因此,进行多项式转化的时候,多项式会产出最高次数为止的所有低高次项。随着原特征矩阵维度的上升,数据会 越来越复杂,维度会越来越多,并且这种维度的增加并不能用太简单的数学公式表达出来,因此多项式回归没有固定的模型表达式。
多项式回归处理非线性问题
数据准备:
from sklearn.preprocessing import PolynomialFeatures as PF
from sklearn.linear_model import LinearRegression
import numpy as np

rnd = np.random.RandomState(42)
X = rnd.uniform(-3,3,size=100)
y = np.sin(X) + rnd.normal(size=len(X)) / 3
X = X.reshape(-1,1)
line = np.linspace(-3,3,1000,endpoint=False).reshape(-1,1)
升维与未升维对比:
LinearR = LinearRegression().fit(X,y)
d = 5
LinearR_ = LinearRegression().fit(X,y)
X_ = PF(degree=d).fit_transform(X)
LinearR_ = LinearRegression().fit(X_,y)
line_ = PF(degree=d).fit_transform(line)

fig,ax1 = plt.subplots(1)
ax1.plot(line,LinearR.predict(line),linewidth=2,color='green',label="linear regression")
ax1.plot(line,LinearR_.predict(line_),linewidth=2,color='red',label="Polynomial regression")
ax1.plot(X[:,0],y,'o',c='k')
ax1.legend(loc="best")
ax1.set_ylabel("Regression output")
ax1.set_xlabel("Input feature")
ax1.set_title("Linear Regression ordinary vs poly")
plt.tight_layout()
plt.show()

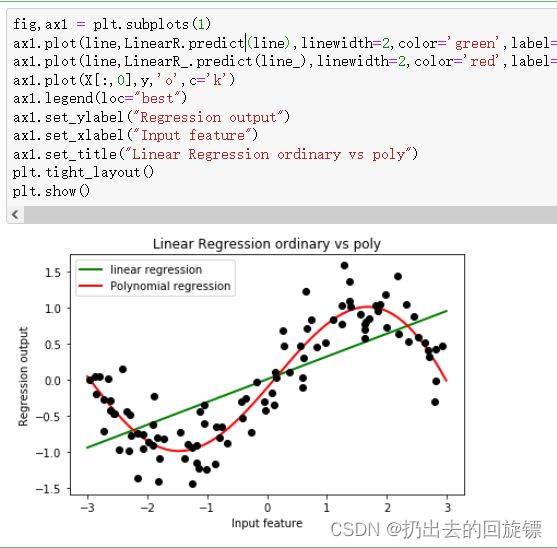
可以看到多项式回归可以较好的拟合非线性数据,还不容易发生过拟合
多项式回归的可解释性
即使用get_feature_names来调用生成的新特征矩阵的各个特征上的名称
X = np.arange(9).reshape(3,3)
X
Poly = PolynomialFeatures(degree=5).fit(X)
Poly.get_feature_names()
线性还是非线性模型
狭义线性模型:自变量上不能有高此项,自变量与标签之间不能存在非线性关系
广义线性模型:只要标签与模型拟合出的参数之间的关系是线性的,模型就是线性的
对于多项式回归本身的属性来说,如果考虑狭义线性模型的定义,那它就是不是线性模型,并且统计学中认为特征之间若精确存在相关关系或高度相关关系,线性模型的估计就会失真难以准确估计。但是如果考虑广义定义,那么多项式回归就是一种线性模型,它的系数w之间并没有相乘或者相除,python处理数据也不会知道特征的变化来源。所以一般认为多项式回归是一种特殊的线性模型

