《不平衡数据的分类》——译自tensorflow官方教程
本文译自TensorFLow的官方教程:Classification on imbalanced data
本教程演示了如何对一个高度不平衡的数据集进行分类,其中一个类中的示例数量大大超过另一个类中的示例数量。您将使用托管在Kaggle上的信用卡欺诈检测数据集。其目的是在总计284,807笔交易中检测出492笔欺诈交易。您将使用Keras来定义模型和类的权重,以帮助模型从不平衡的数据中学习。
本教程包括如下的完整代码:
- 使用Pandas加载CSV文件
- 创建训练、验证和测试集
- 使用Keras定义和训练模型(包括设置类权重)
- 使用各种指标(包括精确度和召回率)评估模型
- 尝试处理不平衡数据的常见技术,如:
- 类权重技术
- 过采样技术
初始配置
import tensorflow as tf
from tensorflow import keras

import os
import tempfile

import matplotlib as mpl
import matplotlib.pyplot as plt
import numpy as np
import pandas as pd
import seaborn as sns

import sklearn
from sklearn.metrics import confusion_matrix
from sklearn.model_selection import train_test_split
from sklearn.preprocessing import StandardScaler
mpl.rcParams['figure.figsize'] = (12, 10)
colors = plt.rcParams['axes.prop_cycle'].by_key()['color']
数据处理与勘探
下载Kaggle信用卡欺诈数据集
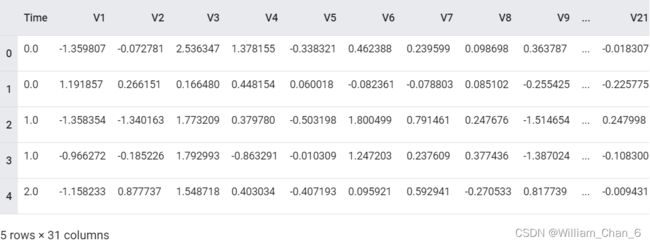
Pandas是一个Python库,有很多有用的工具用于加载和处理结构化数据。它可以用来下载CSV文件,并使用Pandas DataFrame来读取文件。
file = tf.keras.utils
raw_df = pd.read_csv('https://storage.googleapis.com/download.tensorflow.org/data/creditcard.csv')
raw_df.head()
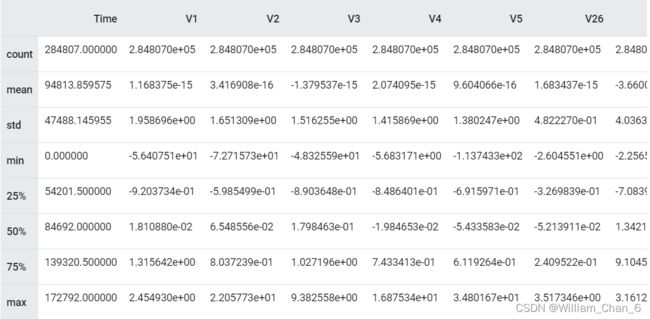
raw_df[['Time', 'V1', 'V2', 'V3', 'V4', 'V5', 'V26', 'V27', 'V28', 'Amount', 'Class']].describe()
检查数据类别的不平衡度
数据集的不平衡度:
neg, pos = np.bincount(raw_df['Class'])
total = neg + pos
print('Examples:\n    Total: {}\n    Positive: {} ({:.2f}% of total)\n'.format(
    total, pos, 100 * pos / total))
Examples:
Total: 284807
Positive: 492 (0.17% of total)
这表明阳性样本的比例很小。
数据清理、划分和规范化
原始数据有几个问题。首先,Time和Amount列变量太多,不能直接使用。删除Time列(因为其含义不明),并对Amount列取对数以减小其范围。
cleaned_df = raw_df.copy()

# You don't want the `Time` column.
cleaned_df.pop('Time')

# The `Amount` column covers a huge range. Convert to log-space.
eps = 0.001 # 0 => 0.1¢
cleaned_df['Log Ammount'] = np.log(cleaned_df.pop('Amount')+eps)
将数据集分割为训练集、验证集和测试集。在模型训练过程中使用验证集来评估loss和任何指标,但是模型并未在这些数据上训练。测试集在训练阶段完全没有使用,只在最后用于评估模型对新数据的泛化程度。这对于不平衡的数据集尤其重要,因为过拟合是缺乏训练数据的一个重要问题。
# Use a utility from sklearn to split and shuffle your dataset.
train_df, test_df = train_test_split(cleaned_df, test_size=0.2)
train_df, val_df = train_test_split(train_df, test_size=0.2)

# Form np arrays of labels and features.
train_labels = np.array(train_df.pop('Class'))
bool_train_labels = train_labels != 0
val_labels = np.array(val_df.pop('Class'))
test_labels = np.array(test_df.pop('Class'))

train_features = np.array(train_df)
val_features = np.array(val_df)
test_features = np.array(test_df)
使用sklearn StandardScaler规范输入特征。这将使平均值为O,标准偏差为1。
scaler = StandardScaler()
train_features = scaler.fit_transform(train_features)

val_features = scaler.transform(val_features)
test_features = scaler.transform(test_features)

train_features = np.clip(train_features, -5, 5)
val_features = np.clip(val_features, -5, 5)
test_features = np.clip(test_features, -5, 5)


print('Training labels shape:', train_labels.shape)
print('Validation labels shape:', val_labels.shape)
print('Test labels shape:', test_labels.shape)

print('Training features shape:', train_features.shape)
print('Validation features shape:', val_features.shape)
print('Test features shape:', test_features.shape)
Training labels shape: (182276,)
Validation labels shape: (45569,)
Test labels shape: (56962,)
Training features shape: (182276, 29)
Validation features shape: (45569, 29)
Test features shape: (56962, 29)
注意:如果希望部署模型,保留预处理计算是非常重要的。最简单的方法是将它们实现为一层网络,并将它附加到要部署的模型中。
观察数据分布
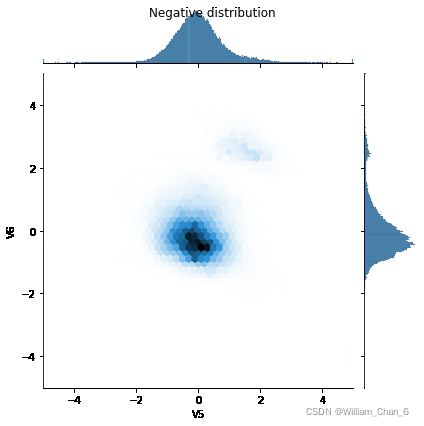
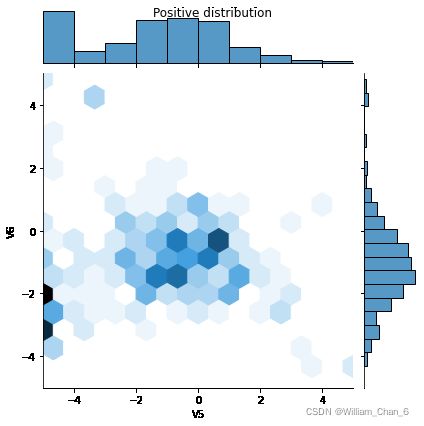
接下来比较正例子和负例子在一些特征上的分布。观察的主要内容为:
- 这些分布有意义吗?
- 是的。你已经对输入数据进行了标准化,使其主要集中在±2范围内。
- 你能看出两种样本分布的不同吗?
- 是的,正面的例子包含了更高的极值率。
pos_df = pd.DataFrame(train_features[ bool_train_labels], columns=train_df.columns)
neg_df = pd.DataFrame(train_features[~bool_train_labels], columns=train_df.columns)

sns.jointplot(x=pos_df['V5'], y=pos_df['V6'],
              kind='hex', xlim=(-5,5), ylim=(-5,5))
plt.suptitle("Positive distribution")

sns.jointplot(x=neg_df['V5'], y=neg_df['V6'],
              kind='hex', xlim=(-5,5), ylim=(-5,5))
_ = plt.suptitle("Negative distribution")
定义模型和指标
定义一个函数,该函数创建一个简单的神经网络,其中包含一个全连接的隐藏层,一个dropout层以减少过拟合,以及一个输出sigmoid层,该层返回交易被欺骗的概率:
METRICS = [
      keras.metrics.TruePositives(name='tp'),
      keras.metrics.FalsePositives(name='fp'),
      keras.metrics.TrueNegatives(name='tn'),
      keras.metrics.FalseNegatives(name='fn'),
      keras.metrics.BinaryAccuracy(name='accuracy'),
      keras.metrics.Precision(name='precision'),
      keras.metrics.Recall(name='recall'),
      keras.metrics.AUC(name='auc'),
      keras.metrics.AUC(name='prc', curve='PR'), # precision-recall curve
]

def make_model(metrics=METRICS, output_bias=None):
  if output_bias is not None:
    output_bias = tf.keras.initializers.Constant(output_bias)
  model = keras.Sequential([
      keras.layers.Dense(
          16, activation='relu',
          input_shape=(train_features.shape[-1],)),
      keras.layers.Dropout(0.5),
      keras.layers.Dense(1, activation='sigmoid',
                         bias_initializer=output_bias),
  ])

  model.compile(
      optimizer=keras.optimizers.Adam(learning_rate=1e-3),
      loss=keras.losses.BinaryCrossentropy(),
      metrics=metrics)

  return model
了解有用的指标
请注意,上面定义的一些指标可以由模型计算出来,这对评估性能很有帮助。
- 假阴性和假阳性是错误分类的样本
- 真阴性和真阳性是正确分类的样本
- 正确率(accuracy)是指总样本中正确分类的样本百分比
- 准确率(precision)是指预测阳性样本中正确分类的样本百分比,详见参考
- 召回率(recall)是指实际阳性样本中正确分类的样本百分比,详见参考
- AUC(AUROC)是指ROC曲线下面积,详见百度百科。这个指标等于分类器将随机正样本排名高于随机负样本的概率
- AUPRC是指PR曲线下面积,详见参考
注意:对于不平衡数据的分类任务,正确率不是一个有用的度量标准。因为当你所有的预测都是阴性,你可以有99.8%以上的准确率。
基准(Baseline)模型
构建模型
现在,使用前面定义的函数来创建和训练模型。请注意,该模型使用的是比默认的2048更大的batch大小,这对于确保每个batch都有相当大的机会包含一些阳性样本非常重要。如果batch太小,模型很可能没有可以从中学习阳性样本。
注意:这个模型不能很好地处理数据的不平衡。您将在本教程的后面部分对其进行改进。
EPOCHS = 100
BATCH_SIZE = 2048

early_stopping = tf.keras.callbacks.EarlyStopping(
    monitor='val_prc',
    verbose=1,
    patience=10,
    mode='max',
    restore_best_weights=True)
model = make_model()
model.summary()
Model: "sequential"
_________________________________________________________________
 Layer (type)                Output Shape              Param #
=================================================================
 dense (Dense)               (None, 16)                480

 dropout (Dropout)           (None, 16)                0

 dense_1 (Dense)             (None, 1)                 17

=================================================================
Total params: 497
Trainable params: 497
Non-trainable params: 0
_________________________________________________________________
测试模型:
model.predict(train_features[:10])
array([[0.9466284 ],
       [0.7211031 ],
       [0.60527885],
       [0.8335568 ],
       [0.5909625 ],
       [0.6751574 ],
       [0.6623665 ],
       [0.81066036],
       [0.50712407],
       [0.8296292 ]], dtype=float32)
可选:设置正确的初始偏差
这些最初的猜测并不好。你知道数据集是不平衡的。设置输出层的偏差来反映这一点(参见:A Recipe for Training Neural Networks:“init well”)。这对于初始收敛很有帮助。
在默认偏置初始化的情况下,损失应该是math.log(2) = 0.69314
results = model.evaluate(train_features, train_labels, batch_size=BATCH_SIZE, verbose=0)
print("Loss: {:0.4f}".format(results[0]))
# Loss: 1.2781
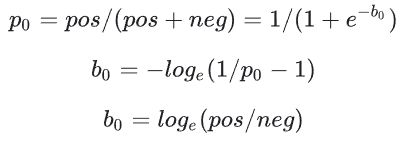
initial_bias = np.log([pos/neg]) # array([-6.35935934])
将其设为初始偏差,模型将给出更合理的初始预测。它应该接近:pos/total = 0.0018
model = make_model(output_bias=initial_bias)
model.predict(train_features[:10])
array([[2.3598122e-05],
       [1.5476024e-03],
       [6.8338902e-04],
       [9.4873342e-04],
       [1.0742771e-03],
       [7.7475846e-04],
       [1.2199467e-03],
       [5.5399281e-04],
       [1.6213538e-03],
       [3.0470363e-04]], dtype=float32)
results = model.evaluate(train_features, train_labels, batch_size=BATCH_SIZE, verbose=0)
print("Loss: {:0.4f}".format(results[0]))
# Loss: 0.0200
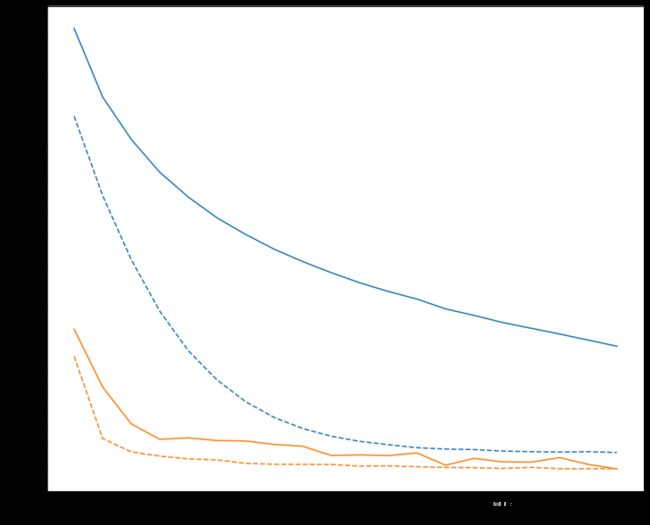
该方法的初始loss值比原始方法减小近50倍。
这样一来,模型就不需要在最初的几个epoch里仅仅学习到阳性样本很少出现。这也使训练过程的loss图更容易理解。
记录初始权重
为了使各种训练运行更具可比性,将这个初始模型的权值保存在一个checkpoint文件中,并在训练前将其加载到每个模型中:
initial_weights = os.path.join(tempfile.mkdtemp(), 'initial_weights')
model.save_weights(initial_weights)
确认bias修正的作用
在继续之前,请快速确认仔细的偏置初始化确实有帮助。将模型训练20个epoch,比较有无bias修正的损失:
model = make_model()
model.load_weights(initial_weights)
model.layers[-1].bias.assign([0.0])
zero_bias_history = model.fit(
    train_features,
    train_labels,
    batch_size=BATCH_SIZE,
    epochs=20,
    validation_data=(val_features, val_labels),
    verbose=0)
model = make_model()
model.load_weights(initial_weights)
careful_bias_history = model.fit(
    train_features,
    train_labels,
    batch_size=BATCH_SIZE,
    epochs=20,
    validation_data=(val_features, val_labels),
    verbose=0)
def plot_loss(history, label, n):
  # Use a log scale on y-axis to show the wide range of values.
  plt.semilogy(history.epoch, history.history['loss'],
               color=colors[n], label='Train ' + label)
  plt.semilogy(history.epoch, history.history['val_loss'],
               color=colors[n], label='Val ' + label,
               linestyle="--")
  plt.xlabel('Epoch')
  plt.ylabel('Loss')
plot_loss(zero_bias_history, "Zero Bias", 0)
plot_loss(careful_bias_history, "Careful Bias", 1)
训练模型
model = make_model()
model.load_weights(initial_weights)
baseline_history = model.fit(
    train_features,
    train_labels,
    batch_size=BATCH_SIZE,
    epochs=EPOCHS,
    callbacks=[early_stopping],
    validation_data=(val_features, val_labels))
记录训练过程
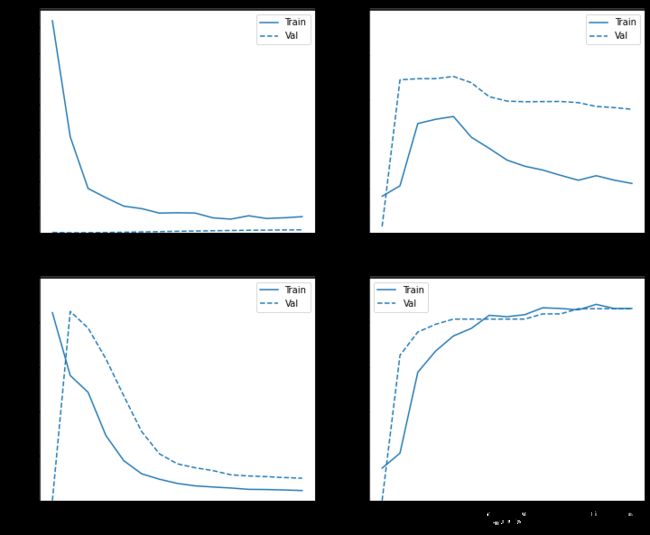
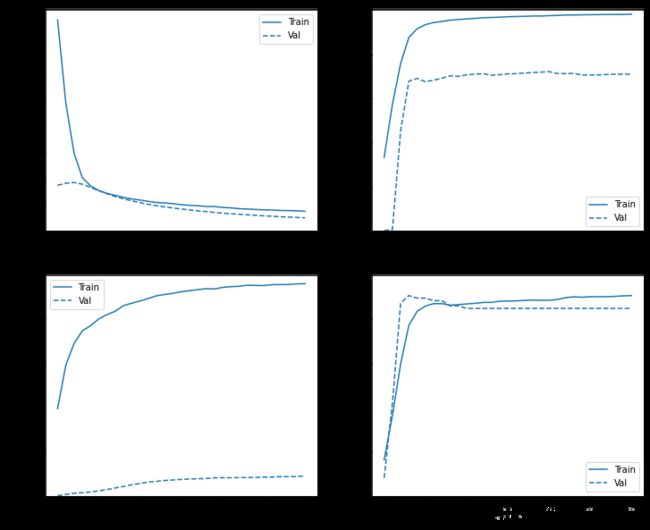
在本节中,您将在训练和验证集上生成模型的正确率和loss的图表。这些对于检查过拟合很有用,你可以在过拟合和过拟合教程中了解更多。
此外,您可以为上面创建的任何指标生成这些图,以下的假阴样本就是一个例子。
def plot_metrics(history):
  metrics = ['loss', 'prc', 'precision', 'recall']
  for n, metric in enumerate(metrics):
    name = metric.replace("_"," ").capitalize()
    plt.subplot(2,2,n+1)
    plt.plot(history.epoch, history.history[metric], color=colors[0], label='Train')
    plt.plot(history.epoch, history.history['val_'+metric],
             color=colors[0], linestyle="--", label='Val')
    plt.xlabel('Epoch')
    plt.ylabel(name)
    if metric == 'loss':
      plt.ylim([0, plt.ylim()[1]])
    elif metric == 'auc':
      plt.ylim([0.8,1])
    else:
      plt.ylim([0,1])

    plt.legend();
plot_metrics(baseline_history)
注意:验证曲线通常比训练曲线更好。这主要是由于验证时未激活dropout层。
评估指标
你可以使用混淆矩阵来汇总实际标签和预测标签,其中X轴是预测标签,Y轴是实际标签:
train_predictions_baseline = model.predict(train_features, batch_size=BATCH_SIZE)
test_predictions_baseline = model.predict(test_features, batch_size=BATCH_SIZE)
def plot_cm(labels, predictions, p=0.5):
  cm = confusion_matrix(labels, predictions > p)
  plt.figure(figsize=(5,5))
  sns.heatmap(cm, annot=True, fmt="d")
  plt.title('Confusion matrix @{:.2f}'.format(p))
  plt.ylabel('Actual label')
  plt.xlabel('Predicted label')

  print('Legitimate Transactions Detected (True Negatives): ', cm[0][0])
  print('Legitimate Transactions Incorrectly Detected (False Positives): ', cm[0][1])
  print('Fraudulent Transactions Missed (False Negatives): ', cm[1][0])
  print('Fraudulent Transactions Detected (True Positives): ', cm[1][1])
  print('Total Fraudulent Transactions: ', np.sum(cm[1]))
在测试数据集上评估你的模型,并显示你在上面创建的指标的结果:
baseline_results = model.evaluate(test_features, test_labels,
                                  batch_size=BATCH_SIZE, verbose=0)
for name, value in zip(model.metrics_names, baseline_results):
  print(name, ': ', value)
print()

plot_cm(test_labels, test_predictions_baseline)
loss :  0.0024895435199141502
tp :  59.0
fp :  7.0
tn :  56874.0
fn :  22.0
accuracy :  0.9994909167289734
precision :  0.8939393758773804
recall :  0.7283950448036194
auc :  0.9318439960479736
prc :  0.8204483985900879

Legitimate Transactions Detected (True Negatives):  56874
Legitimate Transactions Incorrectly Detected (False Positives):  7
Fraudulent Transactions Missed (False Negatives):  22
Fraudulent Transactions Detected (True Positives):  59
Total Fraudulent Transactions:  81
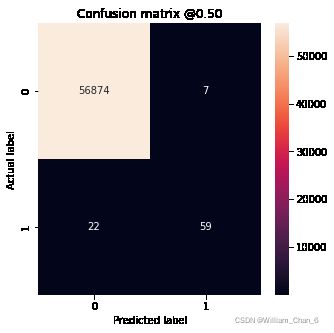
如果模型的预测全部正确,那么这将是一个对角线矩阵,主对角线以外的值将为零,表示不正确的预测为0。在本例中,混淆矩阵有相对较少的误报,这意味着有相对较少的合法交易被错误标记。然而,我们可能希望有更少的假阴性,即使这会增加假阳性的数量。因为现实中可能:假阴性会允许欺诈交易,而假阳性只需向客户发送电子邮件,要求他们验证其信用卡活动。
绘制ROC
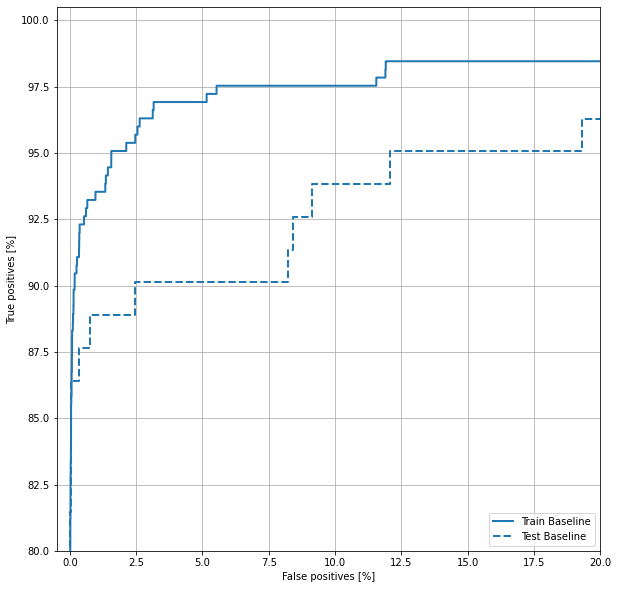
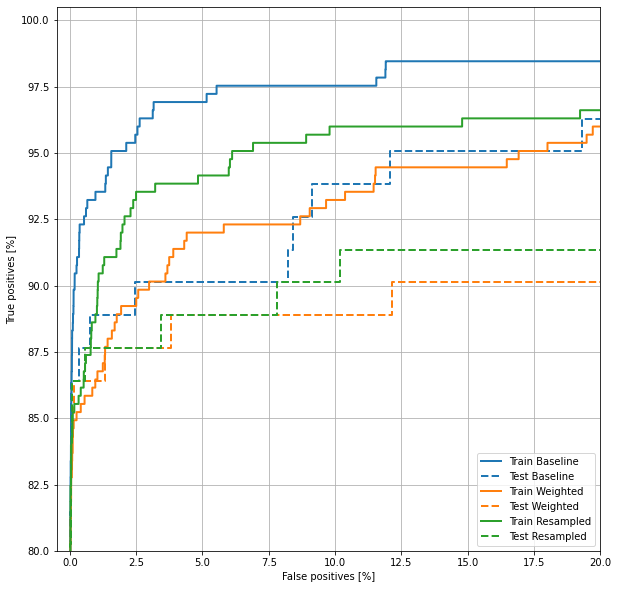
现在画出ROC。这张图很有用,因为它显示了模型仅通过调整输出阈值就可以达到的性能范围。
def plot_roc(name, labels, predictions, **kwargs):
  fp, tp, _ = sklearn.metrics.roc_curve(labels, predictions)

  plt.plot(100*fp, 100*tp, label=name, linewidth=2, **kwargs)
  plt.xlabel('False positives [%]')
  plt.ylabel('True positives [%]')
  plt.xlim([-0.5,20])
  plt.ylim([80,100.5])
  plt.grid(True)
  ax = plt.gca()
  ax.set_aspect('equal')
plot_roc("Train Baseline", train_labels, train_predictions_baseline, color=colors[0])
plot_roc("Test Baseline", test_labels, test_predictions_baseline, color=colors[0], linestyle='--')
plt.legend(loc='lower right');
绘制AUPRC
现在绘制AUPRC。
def plot_prc(name, labels, predictions, **kwargs):
    precision, recall, _ = sklearn.metrics.precision_recall_curve(labels, predictions)

    plt.plot(precision, recall, label=name, linewidth=2, **kwargs)
    plt.xlabel('Recall')
    plt.ylabel('Precision')
    plt.grid(True)
    ax = plt.gca()
    ax.set_aspect('equal')
plot_prc("Train Baseline", train_labels, train_predictions_baseline, color=colors[0])
plot_prc("Test Baseline", test_labels, test_predictions_baseline, color=colors[0], linestyle='--')
plt.legend(loc='lower right');
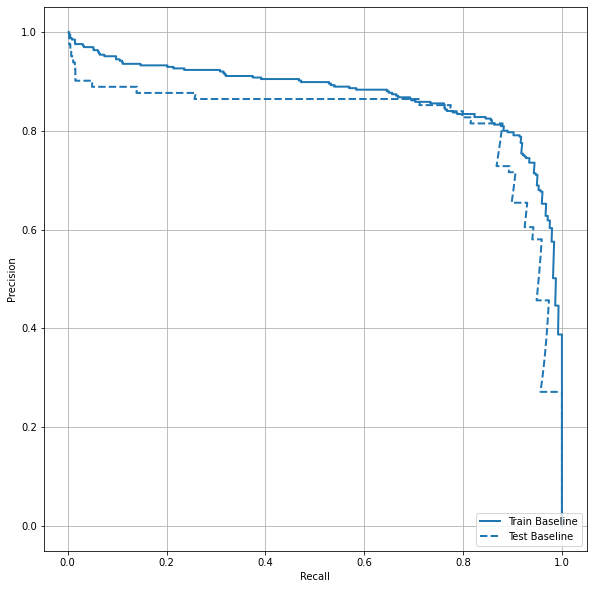
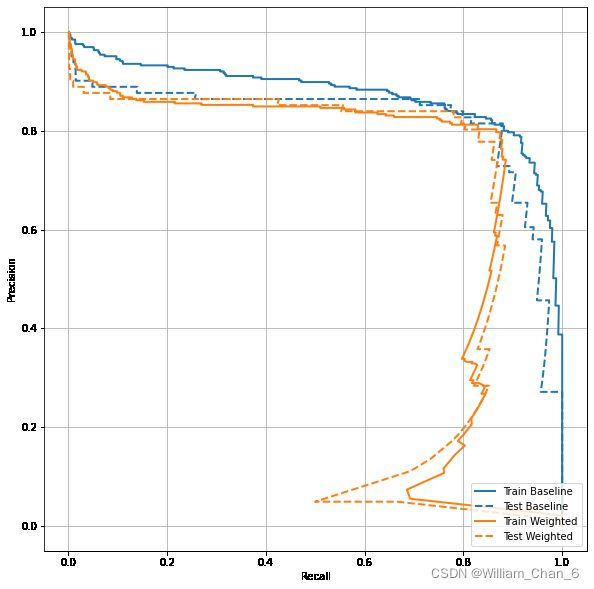
看起来准确率相对较高,但召回率和ROC曲线下的面积(AUC)并没有你想的那么高。模型很难同时提高准确率和召回率,这在处理不平衡数据集时尤其如此。对于不平衡数据,考虑不同样本错误的代价是很重要的。在这个例子中,假阴性(错过了一个欺诈性交易)可能会产生财务成本,而假阳性(错误地标记为欺诈性交易)可能会降低用户体验。
类权重
计算类权重
我们的目标是识别欺诈交易,但是您并没有很多这样的正面示例可以使用,因此您可能想让分类器对少数可用的示例进行大值加权。您可以用一个参数为每个类别传递Keras权重来实现这一点。这将导致模型“更多地注意”数量少的类别。
# Scaling by total/2 helps keep the loss to a similar magnitude.
# The sum of the weights of all examples stays the same.
weight_for_0 = (1 / neg) * (total / 2.0)
weight_for_1 = (1 / pos) * (total / 2.0)

class_weight = {0: weight_for_0, 1: weight_for_1}

print('Weight for class 0: {:.2f}'.format(weight_for_0))
print('Weight for class 1: {:.2f}'.format(weight_for_1))
"""
Weight for class 0: 0.50
Weight for class 1: 289.44
"""
带类权重训练模型
现在,尝试用类权重重新训练和评估模型,看看它如何影响预测。
注意:使用class_weights会改变损失的取值范围。这可能会影响部分优化器的训练的稳定性。步长取决于梯度大小的优化器,如tf.keras.optimizers.SGD,可能会失败。这里使用的优化器tf.keras.optimizer.Adam,则不受loss变化的影响。另外,由于加权,两种模型之间的总损失是不具有可比性的。
weighted_model = make_model()
weighted_model.load_weights(initial_weights)

weighted_history = weighted_model.fit(
    train_features,
    train_labels,
    batch_size=BATCH_SIZE,
    epochs=EPOCHS,
    callbacks=[early_stopping],
    validation_data=(val_features, val_labels),
    # The class weights go here
    class_weight=class_weight)
记录训练过程
plot_metrics(weighted_history)
评估指标
train_predictions_weighted = weighted_model.predict(train_features, batch_size=BATCH_SIZE)
test_predictions_weighted = weighted_model.predict(test_features, batch_size=BATCH_SIZE)

weighted_results = weighted_model.evaluate(test_features, test_labels,
                                           batch_size=BATCH_SIZE, verbose=0)
for name, value in zip(weighted_model.metrics_names, weighted_results):
  print(name, ': ', value)
print()

plot_cm(test_labels, test_predictions_weighted)
loss :  0.014327289536595345
tp :  69.0
fp :  88.0
tn :  56793.0
fn :  12.0
accuracy :  0.9982444643974304
precision :  0.4394904375076294
recall :  0.8518518805503845
auc :  0.9410961866378784
prc :  0.7397712469100952

Legitimate Transactions Detected (True Negatives):  56793
Legitimate Transactions Incorrectly Detected (False Positives):  88
Fraudulent Transactions Missed (False Negatives):  12
Fraudulent Transactions Detected (True Positives):  69
Total Fraudulent Transactions:  81
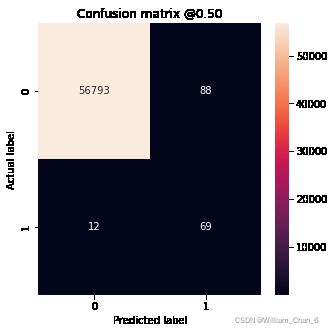
这里可以看到,使用类权重后,由于假阳性样本较多,准确率和精确度较低,但相反,召回率和AUC较高,因为模型也发现了较多的真阳性。尽管正确率较低,该模型召回率较高(能识别出更多的欺诈交易)。当然,这两种类型的错误都有代价(您也不希望将太多的合法交易标记为欺诈)。实际应用中需要仔细权衡这两种错误。
绘制ROC
plot_roc("Train Baseline", train_labels, train_predictions_baseline, color=colors[0])
plot_roc("Test Baseline", test_labels, test_predictions_baseline, color=colors[0], linestyle='--')

plot_roc("Train Weighted", train_labels, train_predictions_weighted, color=colors[1])
plot_roc("Test Weighted", test_labels, test_predictions_weighted, color=colors[1], linestyle='--')


plt.legend(loc='lower right');
绘制AUPRC
plot_prc("Train Baseline", train_labels, train_predictions_baseline, color=colors[0])
plot_prc("Test Baseline", test_labels, test_predictions_baseline, color=colors[0], linestyle='--')

plot_prc("Train Weighted", train_labels, train_predictions_weighted, color=colors[1])
plot_prc("Test Weighted", test_labels, test_predictions_weighted, color=colors[1], linestyle='--')


plt.legend(loc='lower right');
过采样
对少数类别过采样
一个相关的方法是通过对少数类别进行过采样来重组数据集。
pos_features = train_features[bool_train_labels]
neg_features = train_features[~bool_train_labels]

pos_labels = train_labels[bool_train_labels]
neg_labels = train_labels[~bool_train_labels]
使用NumPy
你可以通过从阳性样本中选择合适数量的随机索引来手动平衡数据集:
ids = np.arange(len(pos_features))
choices = np.random.choice(ids, len(neg_features))

res_pos_features = pos_features[choices]
res_pos_labels = pos_labels[choices]

res_pos_features.shape
# (181951, 29)
resampled_features = np.concatenate([res_pos_features, neg_features], axis=0)
resampled_labels = np.concatenate([res_pos_labels, neg_labels], axis=0)

order = np.arange(len(resampled_labels))
np.random.shuffle(order)
resampled_features = resampled_features[order]
resampled_labels = resampled_labels[order]

resampled_features.shape
# (363902, 29)
使用tf.data
如果你在用tf.data,生成平衡数据集的最简单方法是从正数据集和负数据集开始,然后合并它们。详见tf.data guide
BUFFER_SIZE = 100000

def make_ds(features, labels):
  ds = tf.data.Dataset.from_tensor_slices((features, labels))#.cache()
  ds = ds.shuffle(BUFFER_SIZE).repeat()
  return ds

pos_ds = make_ds(pos_features, pos_labels)
neg_ds = make_ds(neg_features, neg_labels)
每个数据集提供(feature, label)数据对:
for features, label in pos_ds.take(1):
  print("Features:\n", features.numpy())
  print()
  print("Label: ", label.numpy())
"""
Features:
 [ 0.56826828  1.24841849 -2.52251105  3.84165891  0.05052604 -0.7621795
 -1.43118352  0.43296139 -1.85102109 -2.50477555  3.20133397 -3.52460861
 -0.95133935 -5.         -1.93144512 -0.7302767  -2.46735228  0.21827555
 -1.45046438  0.21081234  0.39176826 -0.23558789 -0.03611637 -0.62063738
  0.3686766   0.23622961  1.2242418   0.75555829 -1.45589162]

Label:  1
"""
使用tf.data.Dataset.sample_from_datasets将二者合并。
resampled_ds = tf.data.Dataset.sample_from_datasets([pos_ds, neg_ds], weights=[0.5, 0.5])
resampled_ds = resampled_ds.batch(BATCH_SIZE).prefetch(2)
for features, label in resampled_ds.take(1):
  print(label.numpy().mean())
# 0.50732421875
要使用这个数据集,需要知道每个epoch的步数。
在这种情况下,epoch的定义就不那么清晰了。假设这是需要在每个batch中看到一个负面例子的数量:
resampled_steps_per_epoch = np.ceil(2.0*neg/BATCH_SIZE)
resampled_steps_per_epoch
# 278.0
在过采样数据集上训练模型
现在,尝试使用重组的数据集来训练模型,而不是使用类权重,并比较这两种方法。
注意:因为数据是通过复制正示例来平衡的,所以总数据集的大小更大,并且每个epoch运行的训练步骤更多。
resampled_model = make_model()
resampled_model.load_weights(initial_weights)

# Reset the bias to zero, since this dataset is balanced.
output_layer = resampled_model.layers[-1]
output_layer.bias.assign([0])

val_ds = tf.data.Dataset.from_tensor_slices((val_features, val_labels)).cache()
val_ds = val_ds.batch(BATCH_SIZE).prefetch(2)

resampled_history = resampled_model.fit(
    resampled_ds,
    epochs=EPOCHS,
    steps_per_epoch=resampled_steps_per_epoch,
    callbacks=[early_stopping],
    validation_data=val_ds)
如果训练过程在每次梯度更新时考虑整个数据集,那么这种过采样方法与类加权方法基本相同。
但是,当按照上述方法进行模型的分批训练时,过采样数据提供了一个更平滑的梯度信号:阳性样本在多个不同batch中使用小权重计算loss,而不是每个阳性样本在一个batch中使用大权重计算loss。
这种更平滑的梯度信号使模型更容易训练。
记录训练过程
注意这里指标值的分布是不同的,因为训练数据的分布与验证和测试数据完全不同。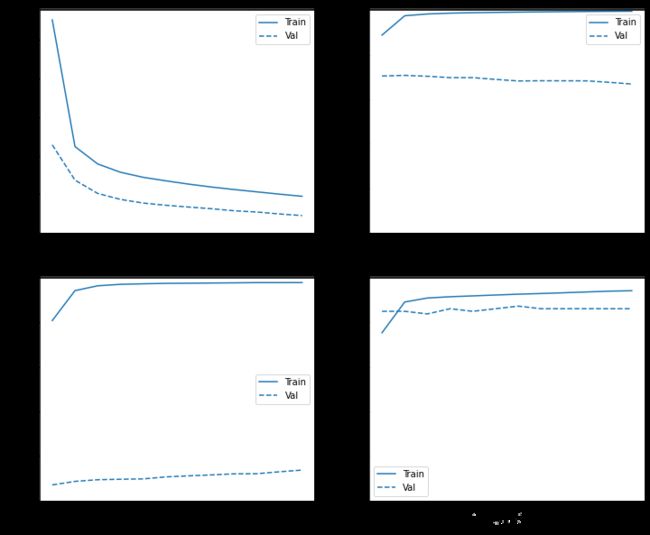
再训练
由于对平衡数据进行训练比较容易,因此上述训练过程可能会很快过拟合。
因此需要使用tf.keras.callbacks.EarlyStopping实现早停。
resampled_model = make_model()
resampled_model.load_weights(initial_weights)

# Reset the bias to zero, since this dataset is balanced.
output_layer = resampled_model.layers[-1]
output_layer.bias.assign([0])

resampled_history = resampled_model.fit(
    resampled_ds,
    # These are not real epochs
    steps_per_epoch=20,
    epochs=10*EPOCHS,
    callbacks=[early_stopping],
    validation_data=(val_ds))
再次记录训练过程
plot_metrics(resampled_history)
评价指标
train_predictions_resampled = resampled_model.predict(train_features, batch_size=BATCH_SIZE)
test_predictions_resampled = resampled_model.predict(test_features, batch_size=BATCH_SIZE)

resampled_results = resampled_model.evaluate(test_features, test_labels,
                                             batch_size=BATCH_SIZE, verbose=0)
for name, value in zip(resampled_model.metrics_names, resampled_results):
  print(name, ': ', value)
print()

plot_cm(test_labels, test_predictions_resampled)
loss :  0.16882120072841644
tp :  71.0
fp :  1032.0
tn :  55849.0
fn :  10.0
accuracy :  0.9817070960998535
precision :  0.06436990201473236
recall :  0.8765432238578796
auc :  0.9518552422523499
prc :  0.7423797845840454

Legitimate Transactions Detected (True Negatives):  55849
Legitimate Transactions Incorrectly Detected (False Positives):  1032
Fraudulent Transactions Missed (False Negatives):  10
Fraudulent Transactions Detected (True Positives):  71
Total Fraudulent Transactions:  81
绘制ROC
plot_roc("Train Baseline", train_labels, train_predictions_baseline, color=colors[0])
plot_roc("Test Baseline", test_labels, test_predictions_baseline, color=colors[0], linestyle='--')

plot_roc("Train Weighted", train_labels, train_predictions_weighted, color=colors[1])
plot_roc("Test Weighted", test_labels, test_predictions_weighted, color=colors[1], linestyle='--')

plot_roc("Train Resampled", train_labels, train_predictions_resampled, color=colors[2])
plot_roc("Test Resampled", test_labels, test_predictions_resampled, color=colors[2], linestyle='--')
plt.legend(loc='lower right');
绘制AUPRC
plot_prc("Train Baseline", train_labels, train_predictions_baseline, color=colors[0])
plot_prc("Test Baseline", test_labels, test_predictions_baseline, color=colors[0], linestyle='--')

plot_prc("Train Weighted", train_labels, train_predictions_weighted, color=colors[1])
plot_prc("Test Weighted", test_labels, test_predictions_weighted, color=colors[1], linestyle='--')

plot_prc("Train Resampled", train_labels, train_predictions_resampled, color=colors[2])
plot_prc("Test Resampled", test_labels, test_predictions_resampled, color=colors[2], linestyle='--')
plt.legend(loc='lower right');
将本教程应用到你的问题中
不平衡的数据的分类实际上是一项困难的任务,因为可供学习的样本太少了。你首先应该从数据开始,尽可能多地收集样本,并充分考虑哪些特征可能是相关的,这样模型才能充分利用你的少数样本。在某些情况下,您的模型可能很难改进并产出您想要的结果,因此务必记住您的问题背景以及不同类型错误之间的权衡。
