高手勿入!直方图均衡化、规定化(匹配)
1.基于直方图的图像增强原理
1.1直方图是什么?
直方图分为一维直方图和二维直方图。文本仅介绍一维直方图,读者可举一反三学会二维直方图。
如上就是一张图片的一维直方图,一维直方图描述的是图片的灰度图形式中灰度级与数量的关系,x轴表示灰度级,y轴表示该灰度级的像素点数量。以下都将一维直方图简称为直方图。
1.2直方图与图像增强
图像的明暗状况与对比度等特征信息都可以通过直方图反应出来。因此可以通过修改直方图的方法来调整一幅数字图像的灰度分布以达到增强图像的目的。常用的方法有直方图均衡化与直方图规定化。
1.3获取直方图,基于opencv
hist=cv.calcHist(images, channels, mask, histSize, ranges[, hist[, accumulate]])
参数解析:
hist:输出直方图。举个例子,对于灰度图来说,有256个不同的像素值,因此hist是一个256行,1列的矩阵,每行中的数值表示图像中对应这个像素值的像素点数量。
images:源图像,应该是把图像放在[]中如:[img]
channels:用于计算直方图的dims通道列表。也以方括号给出。它是我们计算直方图的通道的索引。例如,如果输入为灰度图像,则其值为[0]。对于彩色图像,您可以传递[0],[1]或[2]分别计算蓝色,绿色或红色通道的直方图。
mask:老生常谈,掩膜。需要需找图像特定区域的直方图时才建。
histSize:BIN计数,需要放在[]中,对于全尺寸为[256]。
ranges:通常为[0,256]。
accumulate:累加标志。如果设置了,则在分配直方图时,直方图在开始时不会被清除。此功能使您能够从多组数组中计算单个直方图,或者及时更新直方图。
# 使用范例
import cv2 as cv
img = cv.imread('cr7.jpg',0)
hist = cv.calcHist([img],[0],None,[256],[0,256])
1.4绘制直方图,基于opencv
import cv2 as cv
from matplotlib import pyplot as plt

# 读灰度图
img = cv.imread('cr7.jpg',0)

# 取直方图
hist = cv.calcHist([img],[0],None,[256],[0,256])

# 展示灰度图和直方图
plt.subplot(121), plt.imshow(img, 'gray')
plt.subplot(122), plt.plot(hist),plt.xlim([0,256])
plt.show()
2.直方图均衡化
2.1均衡化原理
2.2均衡化程序实现,基于opencv
均衡化函数:dst=cv.equalizeHist(src[, dst])
灰度图均衡化:
import numpy as np
import cv2 as cv
from matplotlib import pyplot as plt

img = cv.imread('cr7.jpg',0)
img_hist = cv.calcHist([img],[0],None,[256],[0,256])

equ = cv.equalizeHist(img)
equ_hist = cv.calcHist([equ],[0],None,[256],[0,256])

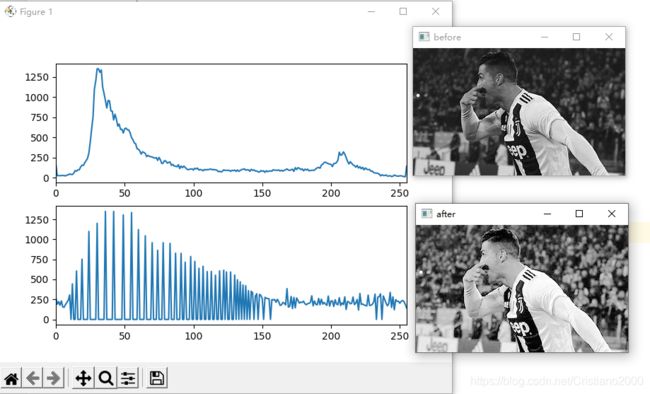
plt.subplot(211), plt.plot(img_hist),plt.xlim([0,255])
plt.subplot(212), plt.plot(equ_hist),plt.xlim([0,255])
plt.show()
彩色图片均衡化:
import numpy as np
import cv2 as cv
from matplotlib import pyplot as plt

img = cv.imread("cr7.jpg")

# 拆分通道
b = img[:,:,0]
g = img[:,:,1]
r = img[:,:,2]

# 得到原来3通道的直方图
b_hist = cv.calcHist([b],[0],None,[256],[0,256])
g_hist = cv.calcHist([g],[0],None,[256],[0,256])
r_hist = cv.calcHist([r],[0],None,[256],[0,256])

# 直方图均衡化
b2 = cv.equalizeHist(b)
g2 = cv.equalizeHist(g)
r2 = cv.equalizeHist(r)

# 查看均衡化后3通道的直方图
b2_hist = cv.calcHist([b2],[0],None,[256],[0,256])
g2_hist = cv.calcHist([g2],[0],None,[256],[0,256])
r2_hist = cv.calcHist([r2],[0],None,[256],[0,256])

img2 = img.copy()
img2[:,:,0] = b2
img2[:,:,1] = g2
img2[:,:,2] = r2

plt.subplot(211), plt.plot(b_hist), plt.plot(g_hist), plt.plot(r_hist), plt.xlim([0,255])
plt.subplot(212), plt.plot(b2_hist), plt.plot(g2_hist), plt.plot(r2_hist), plt.xlim([0,255])
cv.imshow('before',img)
cv.imshow('after',img2)
plt.show()
cv.waitKey(0)
3.直方图规定化
3.1规定化原理
直方图均衡化能自动增强图像的整体对比度,但是往往结果难以受到控制。
实际中常常需要增强某个特定灰度值范围内的对比度或使图像灰度值的分布满足特定需求。这个时候使用直方图规定化会有较好的结果。
离散状态下的规定化步骤:
3.2规定化程序实现,基于opencv
import cv2
import numpy as np
from matplotlib import pyplot as plt

img = cv2.imread('cr7.jpg')
ref = cv2.imread('azr.jpg')

gray = cv2.cvtColor(img, cv2.COLOR_BGR2GRAY)
ref_gray = cv2.cvtColor(ref, cv2.COLOR_BGR2GRAY)
hist = cv2.calcHist([gray], [0], None, [256], [0, 256])
hist_ref = cv2.calcHist([ref_gray], [0], None, [256], [0, 256])
# 计算累计直方图
out = np.zeros_like(img)
tmp_ref = 0.0
h_ref = hist_ref.copy()
for i in range(256):
    tmp_ref += h_ref[i]
    h_ref[i] = tmp_ref
tmp = 0.0
h_acc = hist.copy()
for i in range(256):
    tmp += hist[i]
    h_acc[i] = tmp
# 计算映射
diff = np.zeros([256, 256])
for i in range(256):
    for j in range(256):
        diff[i][j] = np.fabs(h_ref[j] - h_acc[i])
M = np.zeros(256)
for i in range(256):
    index = 0
    min = diff[i][0]  # min = 1.
    for j in range(256):
        if (diff[i][j] < min):
            min = diff[i][j]
            index = int(j)
    M[i] = index
out = M[gray].astype(np.float32)


hist_img = cv2.calcHist([img], [0], None, [255], [0, 255])
hist_ref = cv2.calcHist([ref], [0], None, [255], [0, 255])
hist_out = cv2.calcHist([out], [0], None, [255], [0, 255])

plt.subplot(231)
plt.title("img")
plt.imshow(img)
plt.subplot(234)
plt.plot(hist_img)

plt.subplot(232)
plt.title("ref")
plt.imshow(ref)
plt.subplot(235)
plt.plot(hist_ref)

plt.subplot(233)
plt.title("out")
plt.imshow(out)
plt.subplot(236)
plt.plot(hist_out)

plt.show()
参考:
opencv文档:https://docs.opencv.org/4.5.0/d6/dc7/group__imgproc__hist.html#ga4b2b5fd75503ff9e6844cc4dcdaed35d
一篇挺不错的直方图均衡化CSDN文章:
https://blog.csdn.net/v_xchen_v/article/details/79913245
Python OpenCV 直方图匹配:
https://zhuanlan.zhihu.com/p/323220279


