【数据挖掘】机器学习算法建模实操完整流程(基于Kaggle数据集)
摘要
大部分初学者在学习机器学习算法的时候,常常使用的是像Boston housing,titanic dataset,Iris data等等这样的赶紧数据集,不需要做太多的数据预处理和特征工程。为此,本篇基于kaggle天气数据集进行整个模型真实建立的过程,让大家对数据挖掘整个流程(数据预处理、特征工程、模型建立、模型评估)有个初步的基本认识。
接下来,开始整个模型建立的流程吧。
1. 数据预处理与特征工程
导入相应的包
import warnings
warnings.filterwarnings("ignore")
import pandas as pd
import numpy as np
import math
from sklearn.impute import SimpleImputer
from sklearn.model_selection import train_test_split,cross_val_score
from sklearn.svm import SVC
from sklearn.ensemble import RandomForestClassifier
from sklearn.preprocessing import LabelEncoder,OrdinalEncoder,StandardScaler
from sklearn.metrics import roc_auc_score,recall_score,roc_curve,confusion_matrix
import matplotlib.pyplot as plt
%matplotlib inline
读取数据并查看数据
data = pd.read_csv("./weather.csv",index_col=0)
data.head()

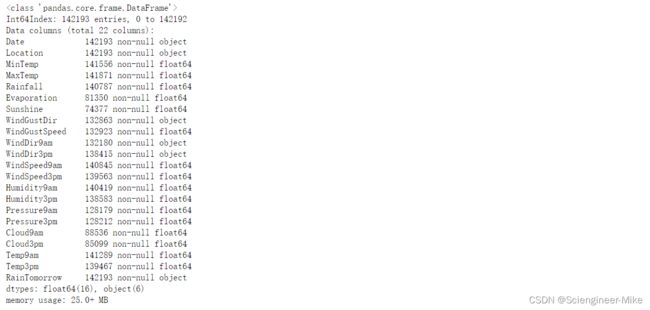
data.info()查看数据信息

发现缺失值比较严重,后面我们将对于字符型特征用众数进行填充,对于连续性特征用均值进行填充。
首先查看特征”Date“,如果按照每天作为特征,那不仅使特征众多复杂,且失去特征的真是意义,我们需要的是月份特征。
特征“RainTomorrow"为我们的标签值,将其yes,no转换为0,1,方便我们后面做计算
data["Date"] = data.loc[:,"Date"].apply(lambda x:int(x.split("-")[1]))
data = data.rename(columns={"Date":"Month"})
data.loc[data["RainTomorrow"]=="Yes","RainTomorrow"] = 1
data.loc[data["RainTomorrow"]=="No","RainTomorrow"] = 0
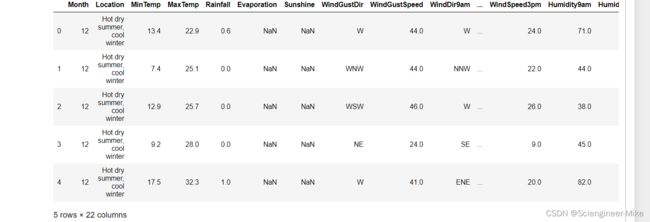
data.head()

对于位置信息,我们从cityInformation.csv得到的是部分重要城市(省会,大城市)的天气类型,
对于数据集里面的小城市,我们讲其距离最近的大城市的天气类型作为其特征处理。
先来查看下"cityInformation.csv"和"citySample.csv"的数据
cityInformation = pd.read_csv("cityInformation.csv", encoding= 'gbk',index_col=0)
citySample = pd.read_csv("citySample.csv",index_col=0)
cityInformation.head()
citySample.head()

#我们将天气类型分配给各个城市,作为我们处理的特征
#对cityInformation出现的城市,直接将“climate”赋予;
对数据集里面没有出现的城市,我们通过地理位置信息,获取其最近城市的天气类型,作为其特征
# 转化经纬度
cityInformation["Lat"] = cityInformation.loc[:,"Latitude"].apply(lambda x:float(x[:-1]))
cityInformation["Long"] = cityInformation.loc[:,"Longitude"].apply(lambda x:float(x[:-1]))
cityInformation = cityInformation.iloc[:,[0,5,6,7]]
citySample["Lat"] = citySample.loc[:,"Latitude"].apply(lambda x:float(x[:-1]))
citySample["Long"] = citySample.loc[:,"Longitude"].apply(lambda x:float(x[:-1]))
citySample = citySample.iloc[:,[0,5,6]]
# convert angle to radiaus
cityInformation["Lat"] = cityInformation.iloc[:,2].apply(lambda x:math.radians(x))
cityInformation["Long"] = cityInformation.iloc[:,3].apply(lambda x:math.radians(x))
citySample["Lat"] = citySample.iloc[:,1].apply(lambda x:math.radians(x))
citySample["Long"] = citySample.iloc[:,2].apply(lambda x:math.radians(x))
# 求与其距离最近的城市的天气类型
for i in range(len(citySample)):
    Lat_1 = cityInformation.loc[:,"Lat"]
    Long_1 = cityInformation.loc[:,"Long"]
    Lat_s = citySample.loc[i,"Lat"]
    Long_s = citySample.loc[i,"Long"]
    distance = 6371.01 * np.arccos(np.sin(Lat_1)*np.sin(Lat_s) +
                          np.cos(Lat_1)*np.cos(Lat_s)*np.cos(Long_1.values - Long_s))
    index = np.argmin(distance)
    citySample.loc[i,"closet_city"] = cityInformation.loc[index,"City"]
    citySample.loc[i,"Climate"] = cityInformation.loc[index,"Climate"]
# 城市名信息没法处理,我们转换为天气信息进行计算
citySample_  = citySample.iloc[:,[0,4]].rename(columns={"City":"Location"})
citySample_ = citySample_.set_index("Location")
citySample_.head()
data["Location"] = data["Location"].map(citySample_.iloc[:,0])
data.head()
# 对于特征Rainfall,我们将其大于1,设置为Yes,小于1,代表No,作为新特征RainToday,并删除Rainfall特征
data.loc[data["Rainfall"]>=1,"RainToday"] = "Yes"
data.loc[data["Rainfall"]<1,"RainToday"] = "No"
data.loc[data["Rainfall"]==np.nan,"RainToday"] = np.nan

del data["Rainfall"]
data = data.rename(columns={"Location":"Climate"})
对字符型数据特征进行众数填充,并进行编码
#获取字符型特征
object_columns = list(data.columns[(data.dtypes)=="object"]) +["Cloud9am","Cloud3pm"]
# 进行缺失值的填充
si = SimpleImputer(missing_values=np.nan,strategy="most_frequent")
data.loc[:,object_columns] = si.fit_transform(data.loc[:,object_columns])
# 填充完需要进行编码,方便后面算法输入
Oe = OrdinalEncoder().fit(data.loc[:,object_columns])
data.loc[:,object_columns] = Oe.transform(data.loc[:,object_columns])
对数值型数据进行均值填充
# 数值型特征进行均值填充
data_columns = data.columns.tolist()
for i in object_columns:
    data_columns.remove(i)
data_columns.remove("RainTomorrow")
si_ = SimpleImputer(missing_values=np.nan,strategy="mean")
data.loc[:,data_columns] = si.fit_transform(data.loc[:,data_columns])
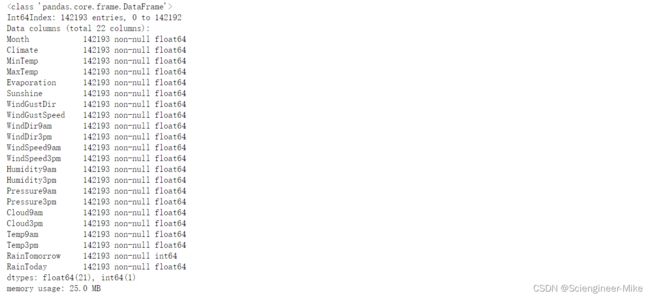
data.info()

通过上面的数据信息可以看到已经没有缺失值了,接下来,将获取的数据特征进行标准化处理。
SS = StandardScaler().fit(data.loc[:,data_columns])
data.loc[:,data_columns] = SS.transform(data.loc[:,data_columns])
data.head()
2.模型建立与模型评估
划分数据特征与标签【X.shape,Y.shape = ((142193, 21), (142193,))】
# 划分特征与标签
Y = data.loc[:,"RainTomorrow"]
X = data.drop(columns=["RainTomorrow"])
在这里,我们选取随机森林算法进行预测明天是否下雨,由于数据量比较大,为节省计算时间,我们选取n_estimators从101-111进行超参数选取。
# 随机森林测试结果
RFC = []
for i in range(100,110):
    rfc = RandomForestClassifier(n_estimators=i+1,random_state=0).fit(Xtrain,ytrain)
    RFC.append(rfc.score(Xtest,ytest))
plt.plot(range(100,110),RFC,color="green")
plt.show()
rfc = RandomForestClassifier(n_estimators=np.argmax(RFC)+100,random_state=0).fit(Xtrain,ytrain)
rfc.score(Xtest,ytest)
可以得到树的数量为108时的准确率达到了0.85888085
支持向量机分类器,是在数据空间中找出一个超平面作为决策边界,利用这个决策边界来对数据进行分类,并使分类误差尽量小的模型。 决策边界是比所在数据空间小一维的空间,在三维数据空间中就是一个平面,在二维数据空间中就是一条直线。
支持向量机重要超参数解读: Kernel(核函数):它是一种能够使用数据原始空间中的向量计算来表示升维后的空间中的点积结果的数学方式。具体表现为:k(xi,xj)=ϕ(xi)∗ϕ(xj)

其他超参数的含义:在知道如何选取核函数后,我们还要观察一下除了kernel之外的核函数相关的参数。对于线性核函数,"kernel"是唯一能够影响它的参数,但是对于其他三种非线性核函数,他们还受到参数gamma,degree以及coef0的影响。参数gamma就是表达式中的 ,degree就是多项式核函数的次数 ,参数coef0就是常数项 。其中,高斯径向基核函数受到gamma的影响,而多项式核函数受到全部三个参数的影响。 对于分类问题,永远都逃不过一个痛点就是样本不均衡问题,所以就引出了超参数class_weight,通过施加比重来优化模型本身。
不同核函数所得到的模型结果
#SVC 不同核函数所得到的模型结果
for kernel in ["linear","poly","rbf","sigmoid"]:
    Clf_svc = SVC(kernel = kernel,
                 gamma = "auto",
                 degree = 1,
                 cache_size=5000).fit(Xtrain,ytrain)
    result = Clf_svc.predict(Xtest)
    score = Clf_svc.score(Xtest,ytest)
    recall = recall_score(ytest,result)
    auc = roc_auc_score(ytest,Clf_svc.decision_function(Xtest))
    print("{0} 's testing accuracy {1}, recall_score is {2}, auc_score is {3}"
                                              .format(kernel,score,recall,auc))
#由于样本不均衡,通过改变class_weight观察模型结果发生什么变化
for i in np.linspace(0.1,1,10):
    clf_svc = SVC(kernel = "linear"
              ,gamma="auto"
              ,cache_size = 5000
              ,class_weight = {1:1+i}
             ).fit(Xtrain, ytrain)
    result = clf_svc.predict(Xtest)
    score = clf_svc.score(Xtest,ytest)
    recall = recall_score(ytest, result)
    auc = roc_auc_score(ytest,clf_svc.decision_function(Xtest))
    print("under ratio 1:%f testing accuracy %f, recall is %f', auc is %f" %(1+i,score,recall,auc))
模型评估指标:混淆矩阵、ROC曲线、AUC
clf_svc = SVC(kernel = "linear"
              ,gamma="auto"
              ,cache_size = 5000
              ,class_weight = {1:1.1}
             ).fit(Xtrain, ytrain)
result = clf_svc.predict(Xtest)
confusion_matrix(ytest,result)
FPR,Recall,thresholds = roc_curve(ytest,clf_svc.decision_function(Xtest))
Area = roc_auc_score(ytest,clf_svc.decision_function(Xtest))
Area
![]()
ax = plt.figure(figsize=(8,5))
ax = plt.axes()
plt.plot(FPR, Recall, color='red',
         label='ROC curve (area = %0.2f)' % Area)
plt.plot([0, 1], [0,1], color='black', linestyle='--')
plt.fill_between(FPR,0,Recall,color = 'green')
plt.xlim([-0.05, 1.05])
plt.ylim([-0.05, 1.05])
ax.spines['top'].set_visible(False)
ax.spines['right'].set_visible(False)
plt.xlabel('False Positive Rate')
plt.ylabel('Recall')
plt.title('Receiver operating characteristic example')
plt.legend(loc="lower right")
plt.show()


