功能强大的python包(九):matplotlib(数据可视化)
1.Matplotlib简介
Matplotlib是一个python绘图库,它以硬拷贝格式和跨平台的交互式环境生成出版物质量的图形。利用它可以以非常少的代码量方便地绘制出我们常用的一些图表。
Matplotlib可以绘制折线图、散点图、柱状图等几十种图表,满足科学研究的需要,是数据分析、可视化的不二之选。
2.Matplotlib总览
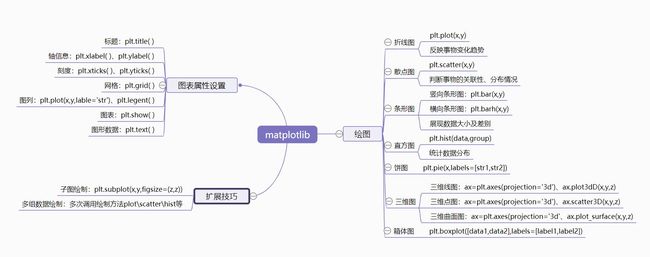
Matplotlib的体量远不止上图所述,它能够绘制多达几十种的图表,但我们最常用的图表就是上述七种:折线图、散点图、条形图、直方图、饼图、三维图、箱体图;而且绝大多数人所用都超出不了这七种。
所以本文将为大家详细介绍这七种图表的绘制。
文章目录
-
-
- 1.Matplotlib简介
- 2.Matplotlib总览
-
-
- 折线图:plt.plot()
- 散点图:plt.scatter()
- 条形图:plt.bar()、plt.barh()
- 直方图:plt.hist()
- 饼图:plot.pie()
- 三维图:ax.plot3D()、ax.scatter3D()、ax.plot_surface()
- 箱体图:plt.boxplot()
-
- 写在最后
-
| 图表类型 | 绘制代码 |
|---|---|
| 折线图 | plt.plot(x,y) |
| 散点图 | plt.scatter(x,y) |
| 条形图 | plt.bar(x,y)、plt.barh(x,y) |
| 直方图 | plt.hist(data,group) |
| 饼图 | plt.pie(x,y) |
| 三维线图 | ax=plt.axes(projection=‘3d’)、ax.plot3D(x,y,z)) |
| 三维点图 | ax=plt.axes(projection=‘3d’)、ax.scatter3D(x,y,z)) |
| 三维曲面图 | ax=plt.axes(projection=‘3d’)、ax.plot_surface(x,y,z) |
| 箱体图 | plt.boxplot([data1,data2],labels=[label1,label2]) |
| 图表属性 | 代码实现 |
|---|---|
| 标题 | plt.title( ) |
| 坐标轴 | plt.xlabel( ),plt.ylabel( ) |
| 刻度 | plt.xticks( )、plt.yticks( ) |
| 网格 | plt.grid( ) |
| 图列 | plt.plot(x,y,label=‘str’)、plt.legend( ) |
| 图表 | plt.show( ) |
| 图形数据 | plt.text( ) |
| 扩展技巧 | 代码实现 |
|---|---|
| 子图绘制 | plt.subplot(x,y,figsize=(z,z)) |
| 多组数据绘制 | 多次调用绘图方法plot、scatter等。 |
折线图:plt.plot()
import numpy as np
import matplotlib.pyplot as plt

"""
plt.plot(x,y,format_string,**kwargs)
x:x轴数据,列表或数组
y:y轴数据,列表或数组
format_string:设置曲线格式
**kwargs:第二组或更多组数据
"""

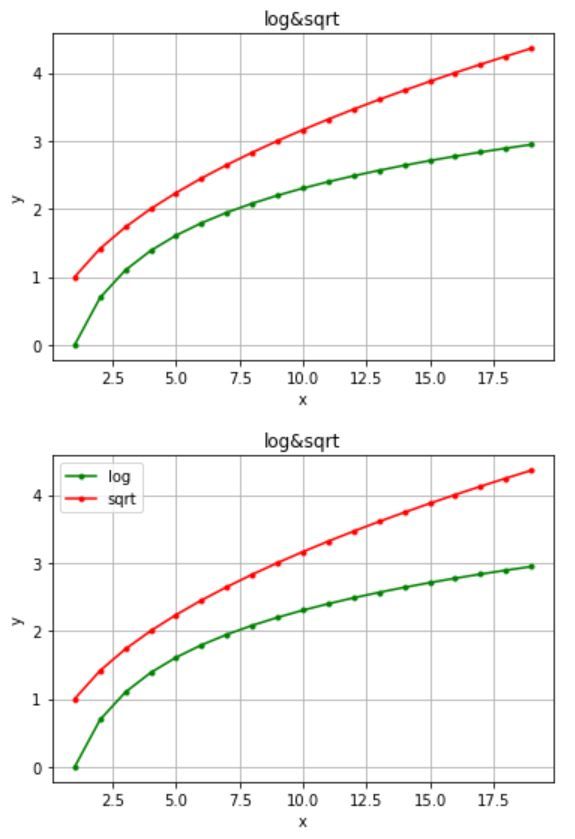
x = np.arange(1,20)
y1 = np.log(x)
y2 = x**0.5

plt.figure()
plt.plot(x,y1,'g.-',x,y2,'r.-')
plt.xlabel('x')
plt.ylabel('y')
plt.grid()
plt.title('log&sqrt')

plt.figure()
plt.plot(x,y1,'g.-',label='log')
plt.plot(x,y2,'r.-',label='sqrt')
plt.xlabel('x')
plt.ylabel('y')
plt.legend()
plt.grid()
plt.title('log&sqrt')
散点图:plt.scatter()
import numpy as np
import matplotlib.pyplot as plt

"""
plt.scatter(x,y,s,c,marker,cmap,norm,vmin,vmax,alpha,linewidth,verts)
x:x轴坐标
y:y轴坐标
s:散点面积
c:散点颜色
maker:散点样式
alpha:散点透明度
linewidths:散点边缘线宽
edgecolors:散点边缘颜色
cmap:matplotlib.colors.Colormap,调色盘合集
norm\vmin\vmax:散点颜色亮度设置
"""

n = 50
x = np.random.rand(n)
y = np.random.rand(n)
sizes = np.random.rand(n)
colors = np.zeros((50,1))
plt.scatter(x,y,s=1000*sizes,c=0.9*colors,alpha=0.3,cmap='viridis')
plt.scatter(x,2*y,s=500*sizes,c=0.2*colors,alpha=0.17)
plt.xlabel('x')
plt.ylabel('y')
plt.title('scatter')
plt.colorbar()
条形图:plt.bar()、plt.barh()
import numpy as np
import matplotlib.pyplot as plt

"""
plt.bar(x,height,width,bottom,color)
x:标量序列,确定x轴刻度数
height:确定y轴刻度
width:直方图宽度
bottom:y轴边界坐标轴起点
color:直方图色彩
"""

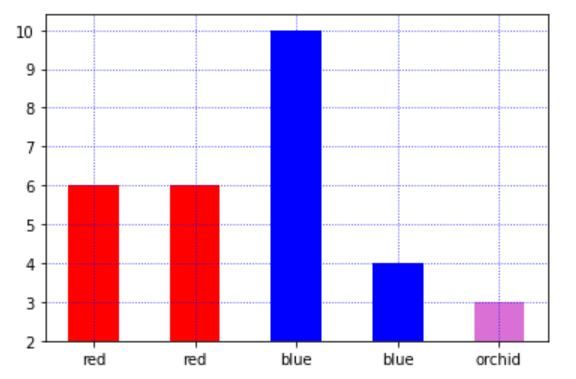
x = [1,2,3,4,5]
y1 = [4,4,8,2,1]
y2 = [6,6,6,8,8]
color = ['red','red','blue','blue','orchid']
x_label = color
plt.figure()
plt.bar(x,y1,color=color,width=0.5,bottom=2)
plt.xticks(x,x_label)
plt.grid(linestyle=':',color='b',alpha=0.8)

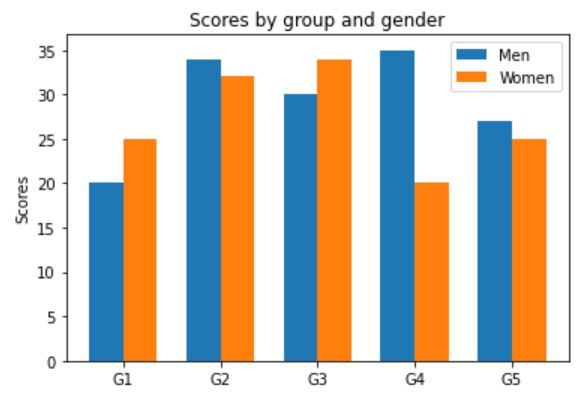
labels = ['G1', 'G2', 'G3', 'G4', 'G5']
men_means = [20, 34, 30, 35, 27]
women_means = [25, 32, 34, 20, 25]
x = np.arange(len(labels))
width = 0.35
fig, ax = plt.subplots()
rects1 = ax.bar(x - width/2, men_means, width, label='Men')
rects2 = ax.bar(x + width/2, women_means, width, label='Women')
ax.set_ylabel('Scores')
ax.set_title('Scores by group and gender')
ax.set_xticks(x)
ax.set_xticklabels(labels)
ax.legend()

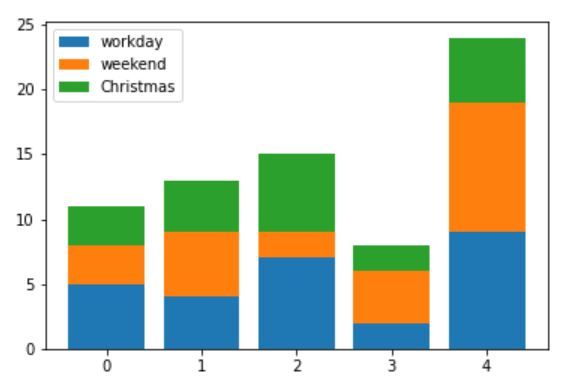
plt.figure()
x=np.arange(5)
y=np.array([5,4,7,2,9])
y1=np.array([3,5,2,4,10])
y2=np.array([3,4,6,2,5])
plt.bar(x,y,label='workday')
plt.bar(x,y1,bottom=y,label='weekend')
plt.bar(x,y2,bottom=y+y1,label='Christmas')
plt.legend()
plt.show()

"""
plt.barh(y,width,height)
y:y坐标轴值
width:柱状图长度,x轴坐标值
height:柱状图高度
"""

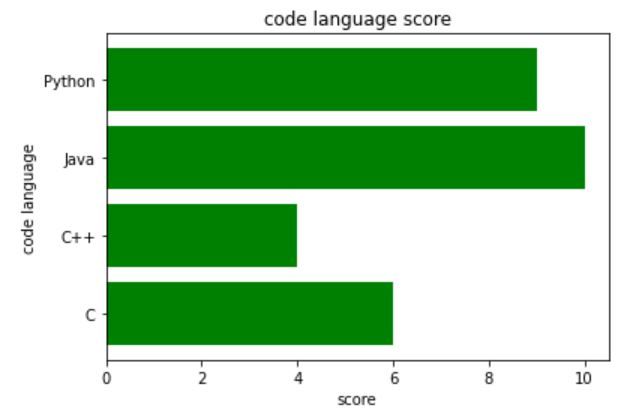
data = {'C':6, 'C++':4, 'Java':10, 'Python':9}
keys = list(data.keys())
values = list(data.values())
plt.figure()
plt.barh(keys, values, color='g')
plt.xlabel("score")
plt.ylabel("code language")
plt.title("code language score")
plt.show()
直方图:plt.hist()
import numpy as np
import matplotlib.pyplot as plt
import matplotlib.mlab as mlab

"""
plt.hist(x,bins,range,density,weights,cumulative,bottom,histtype,align,orientation,rwidth,log,color,label,stacked,hold,**kwargs)
x:指定每个bin分布的数据,对应x轴
bins:指定bin的个数,即条状图个数
normed:指定密度,即每个条状图占比比例
color:指定条状图颜色
"""

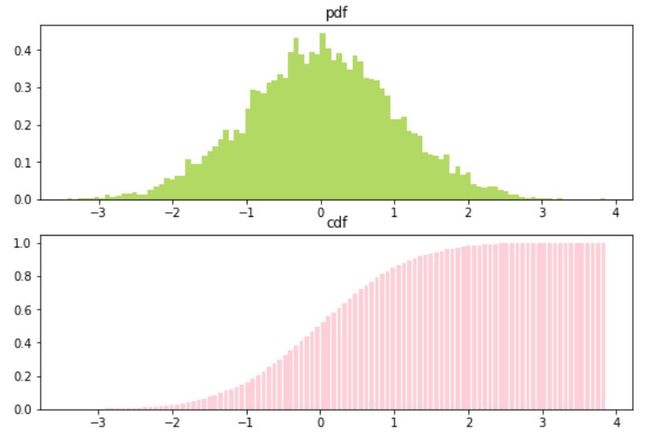
mean = 0
sigma = 1
x=mean+sigma*np.random.randn(10000)
fig,(ax0,ax1) = plt.subplots(nrows=2,figsize=(9,6))
ax0.hist(x,100,density=True,histtype='bar',facecolor='yellowgreen',alpha=0.75)
ax0.set_title('pdf')
ax1.hist(x,100,density=True,histtype='bar',facecolor='pink',alpha=0.75,cumulative=True,rwidth=0.8)
ax1.set_title("cdf")
plt.show()
饼图:plot.pie()
import numpy as np
import matplotlib.pyplot as plt
plt.rcParams['font.sans-serif']=['SimHei']
"""
plt.pie(x,explode,labels,colors,autopct,radius,center)
x:每一块饼的比例
labels:每块饼的说明
explode:饼离开中心的距离
colors:饼图颜色
autopct:控制饼图内百分比
radius:饼图半径
center:饼图中心位置
"""

x = [3,10,4,2]
labels = ['十点韩剧','人类之奴','凯文英语','胖胖啊']
explode = (0,0,0,0.1)
plt.pie(x,explode=explode,labels=labels)
plt.title('公众号')
三维图:ax.plot3D()、ax.scatter3D()、ax.plot_surface()
import numpy as np
import matplotlib.pyplot as plt

"""
ax.plot3D()
ax.scatter3D()
ax.plot_surface()
ax.contour()
"""
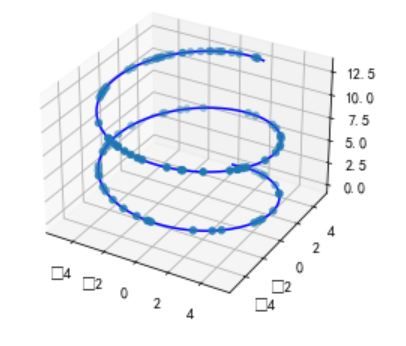
z = np.linspace(0,13,1000)
x = 5*np.sin(z)
y = 5*np.cos(z)
zd = 13*np.random.random(100)
xd = 5*np.sin(zd)
yd = 5*np.cos(zd)
ax1 = plt.axes(projection='3d')
ax1.scatter(xd,yd,zd,cmap='r')
ax1.plot3D(x,y,z,'blue')

plt.figure()
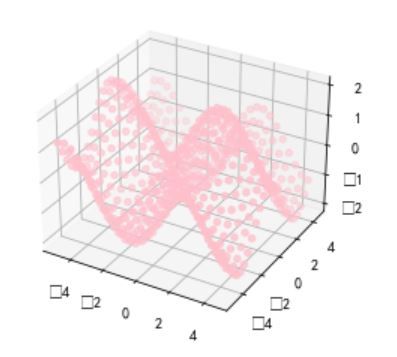
xx = np.arange(-5,5,0.4)
yy = np.arange(-5,5,0.4)
X, Y = np.meshgrid(xx, yy)
Z = np.sin(X)+np.cos(Y)
ax2 = plt.axes(projection='3d')
ax2.scatter3D(X,Y,Z,color='pink')

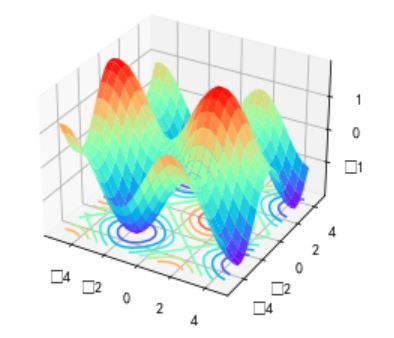
plt.figure()
ax3 = plt.axes(projection='3d')
ax3.plot_surface(X,Y,Z,cmap='rainbow')
ax3.contour(X,Y,Z,offset=-2, cmap = 'rainbow')
箱体图:plt.boxplot()
import numpy as np
import matplotlib.pyplot as plt
import pandas as pd
"""
plt.boxplot(x,notch,sym,vert,whis,positions,widths,patch_artist)
x:绘制箱体图的数据
notch:是否以凹口形式展现箱线图
sym:指定异常点形状
vert:箱线图示是否垂直摆放
whis:指定上下须与上下四分位的距离
positions:指定箱线图位置
widths:指定箱线图宽度
patch_artist:是否颜色填充箱体
"""

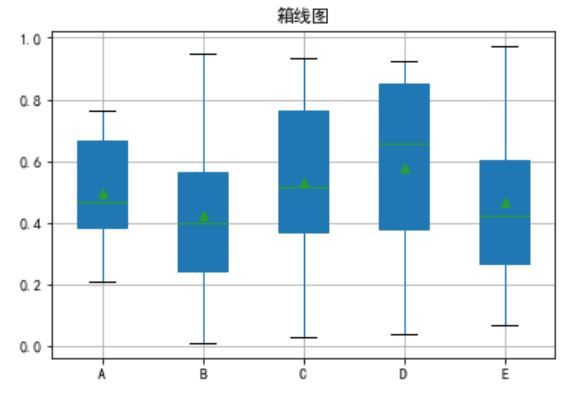
df = pd.DataFrame(np.random.rand(10,5),columns=['A','B','C','D','E'])
f = df.boxplot(sym = 'o',            #异常点形状
               vert = True,          # 是否垂直
               whis=1.5,             # IQR
               patch_artist = True,  # 上下四分位框是否填充
               meanline = False,showmeans = True,  # 是否有均值线及其形状
               showbox = True,   # 是否显示箱线
               showfliers = True,  #是否显示异常值
               notch = False,    # 中间箱体是否缺口
               return_type='dict')  # 返回类型为字典
plt.title('箱线图')
plt.show()
写在最后
内容创造不易,望君点个爱心给个支持,谢谢大家!

