使用python的geopands和rasterio批量裁剪遥感数据
文章目录
- 前言
- 一、geopandas和rasterio的安装
- 二、批量裁剪和镶嵌
-
- 1.数据准备与批量裁剪
- 2.镶嵌
- 总结
前言
这几天在跑模型的时候,需要对遥感影像批量裁剪和镶嵌,本来想使用arcpy完成,但是由于arcpy裁剪工具Spatial Analyst-Extraction-Extract by Mask工具裁剪出来是栅格数据集的形式,不能直接得到tif文件,于是就想直接用python完成。想着以后可能会经常用到这个工具,于是把裁剪和镶嵌代码一起实现了。
一、geopandas和rasterio的安装
这里建议在用conda新环境里安装,因为很多库之间有依赖性,新环境下可以保证安装的都是最新版本或者比较新的版本。我电脑上首先安装了Anaconda库,可以直接使用conda命令创建新环境,创建、删除、激活环境命令可以百度。我电脑上新建的是python3.8环境,刚开始想使用pip在线安装,但是各种报错,于是直接下载离线包。下面给出rasterio包的下载地址:https://www.lfd.uci.edu/~gohlke/pythonlibs/#rasterio
rasterio包依赖于GDAL,可以先在线或者离线安装GDAL(推荐离线安装)。
geopandas依赖库有四个,参考https://geopandas.org/en/latest/getting_started/install.html
四个包在线安装成功了三个,fiona包好像是关联GDAL还是啥安装报错,于是直接离线安装。
安装完四个依赖包后,最后直接使用pip install geopandas完成第一步。
二、批量裁剪和镶嵌
1.数据准备与批量裁剪
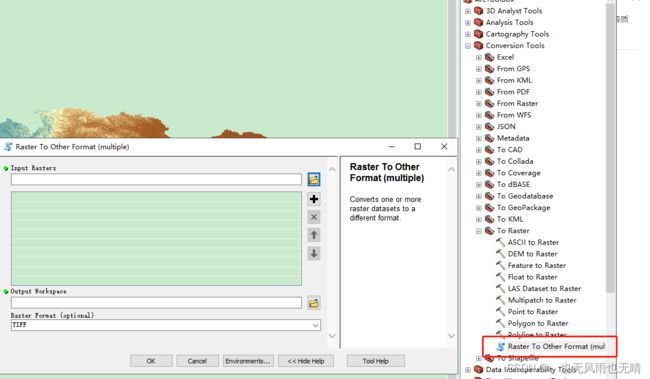
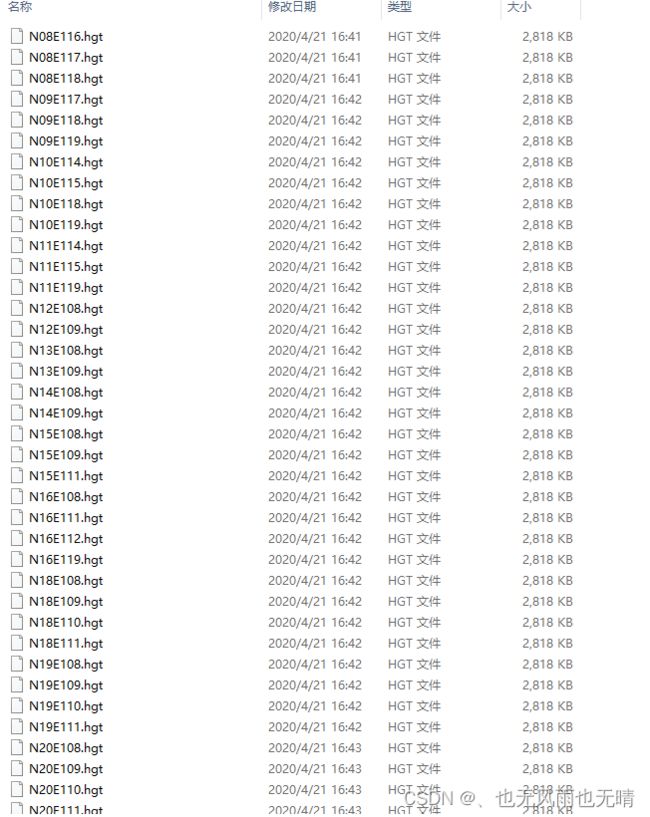
我使用的的是中国dem90米分辨率数据,下载完后是hgt格式,可以使用arcmap批量格式转换工具将数据转成tif。


转换完成后使用一下代码进行批量裁剪,这里只简单交代下代码的用法,输入需要裁剪的tif文件夹pathDir,shpfile为裁剪矢量,save_dir为保存路径,nodata=32767是表示背景的值,由于这里数据格式是int16,所以用最大值表示背景。
代码如下(示例):
import rasterio as rio
from rasterio.mask import mask
from tqdm import tqdm
import glob
import os
import geopandas as gpd
from geopandas import GeoSeries
from osgeo import gdal
import math
import numpy as np

def data_cut():
    pathDir = r'*.tif'
    shpfile = r'Yangtze.shp'
    save_dir = r'' #保存tif
    tif_list = glob.glob(pathDir)
    for i in tqdm(range(len(tif_list))):
        # 读入栅格文件
        rasterfile = tif_list[i]
        rasterdata = rio.open(rasterfile)
        #获取栅格信息
        # profile = rasterdata.profile
        out_meta = rasterdata.meta.copy()
        shpdata = gpd.read_file(shpfile)
        # 投影变换,使矢量数据与栅格数据投影参数一致
        shpdata = shpdata.to_crs(rasterdata.crs)

        # 按照所有矢量进行循环裁剪
        for j in range(0, len(shpdata)):
            try:
                # 获取矢量数据的features
                geo = shpdata.geometry[j]
                #获取该要素的属性信息
                data_shp_name=shpdata.values[j][0]

                #文件保存位置的文件夹
                data_filepath=str(data_shp_name)

                feature = [geo.__geo_interface__]
                # 通过feature裁剪栅格影像
                out_image, out_transform = mask(rasterdata, feature, all_touched=True, crop=True, nodata=32767)
                out_meta.update(
                    height=out_image.shape[1],
                    width=out_image.shape[2],
                    shape=(out_image.shape[1],out_image.shape[2]),
                    nodata=32767,
                    bounds=[],
                    transform=out_transform,
                    )
                # 定义要创建的目录
                mkpath = os.path.join(save_dir, data_filepath)
                # 检测目录是否存在
                if not os.path.exists(mkpath): os.makedirs(mkpath)
                # 文件名字
                name= os.path.join(mkpath, rasterfile.split('\\')[-1])
                with rio.open(name, mode='w', **out_meta) as dst:
                    dst.write(out_image)
            except ValueError as value_err:  # 可以写多个捕获异常
                print(value_err)
2.镶嵌
批量裁剪完成后,使用gdal库进行镶嵌,代码出自https://blog.csdn.net/SunStrongInChina/article/details/104274422
这里给个引用。
代码如下(示例):
def GetExtent(in_fn):
    ds=gdal.Open(in_fn)
    geotrans=list(ds.GetGeoTransform())
    xsize=ds.RasterXSize
    ysize=ds.RasterYSize
    min_x=geotrans[0]
    max_y=geotrans[3]
    max_x=geotrans[0]+xsize*geotrans[1]
    min_y=geotrans[3]+ysize*geotrans[5]
    ds=None
    return min_x,max_y,max_x,min_y

def mosaic():
    path = r""
    os.chdir(path)
    # 如果存在同名影像则先删除
    if os.path.exists('mosaiced_image.tif'):
        os.remove('mosaiced_image.tif')
    in_files = glob.glob("*.tif")
    in_fn = in_files[0]
    # 获取待镶嵌栅格的最大最小的坐标值
    min_x, max_y, max_x, min_y = GetExtent(in_fn)
    for in_fn in in_files[1:]:
        minx, maxy, maxx, miny = GetExtent(in_fn)
        min_x = min(min_x, minx)
        min_y = min(min_y, miny)
        max_x = max(max_x, maxx)
        max_y = max(max_y, maxy)
    # 计算镶嵌后影像的行列号
    in_ds = gdal.Open(in_files[0])
    geotrans = list(in_ds.GetGeoTransform())
    width = geotrans[1]
    height = geotrans[5]

    columns = math.ceil((max_x - min_x) / width)
    rows = math.ceil((max_y - min_y) / (-height))
    in_band = in_ds.GetRasterBand(1)

    driver = gdal.GetDriverByName('GTiff')
    out_ds = driver.Create('mosaiced_image.tif', columns, rows, 1, in_band.DataType)
    out_ds.SetProjection(in_ds.GetProjection())
    geotrans[0] = min_x
    geotrans[3] = max_y
    out_ds.SetGeoTransform(geotrans)
    out_band = out_ds.GetRasterBand(1)
    # 定义仿射逆变换
    inv_geotrans = gdal.InvGeoTransform(geotrans)
    # 开始逐渐写入
    for in_fn in in_files:
        in_ds = gdal.Open(in_fn)
        in_gt = in_ds.GetGeoTransform()
        # 仿射逆变换
        offset = gdal.ApplyGeoTransform(inv_geotrans, in_gt[0], in_gt[3])
        x, y = map(int, offset)
        print(x, y)
        trans = gdal.Transformer(in_ds, out_ds, [])  # in_ds是源栅格,out_ds是目标栅格
        success, xyz = trans.TransformPoint(False, 0, 0)  # 计算in_ds中左上角像元对应out_ds中的行列号
        x, y, z = map(int, xyz)
        print(x, y, z)
        data = in_ds.GetRasterBand(1).ReadAsArray()
        out_band.WriteArray(data, x, y)  # x,y是开始写入时左上角像元行列号
    del in_ds, out_band, out_ds
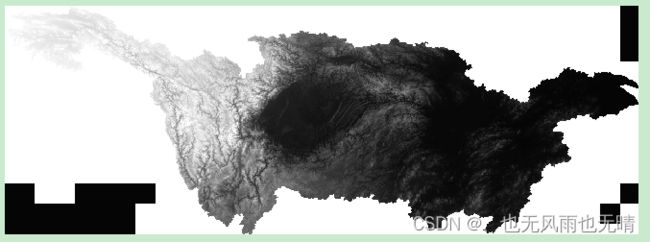
拼接后的效果:

我最后使用Spatial Analyst-Extraction-Extract by Mask将数据再裁剪了一遍。
tips: 黑色区域我以为代码有问题,于是使用了镶嵌代码直接拼接长江流域的所有DEM,还是存在黑色区域,所以可能是dem有问题。
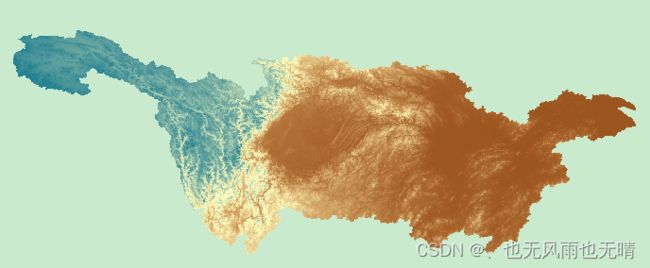
裁剪后的长江流域dem:

总结
今天使用了python的geopandas库和ransterio库对遥感影像实现了批量裁剪和拼接,代码稍微改下可以实现中国所有省份的裁剪和拼接。