pandas学习(四)——分组
文章目录
- 4.1、分组模式及其对象
-
- 4.1.1、分组的一般模式
- 4.1.2、分组依据的本质
- 4.1.3、*groupby*对象
- 4.1.4、分组的三大操作
- 4.2、聚合函数
-
- 4.2.1、内置聚合函数
- 4.2.2、*agg*方法
- 4.3 、变换和过滤
-
- 4.3.1、变换函数与*transform*方法
- 4.3.2、组索引与过滤
- 4.4、跨列分组
-
- 4.4.1、apply操作的引入
- 4.4.2、*apply*的使用
- 4.5、练习
-
- 4.5.1汽车数据集
- 4.5.2、实现*transform*函数
import pandas as pd
import numpy as np


df = pd.read_csv('E:\\DataWhale组队学习\\data\\learn_pandas.csv')
4.1、分组模式及其对象
4.1.1、分组的一般模式
df.groupby(分组依据)[数据来源].使用操作
如统计不同年级的学生的平均体重,这里分组依据是年级,数据来源是体重,使用操作是均值方法:
>>>df.groupby('Grade')['Weight'].mean()
Grade
Freshman     54.568627
Junior       54.036364
Senior       56.576923
Sophomore    54.870968
Name: Weight, dtype: float64
4.1.2、分组依据的本质
实际上,在构建groupby对象时可传入下列参数:
DataFrame.groupby(by=None, axis=0, level=None, as_index=True, sort=True, group_keys=True, squeeze=<object object>, observed=False, dropna=True)
其中最重要的是by关键字

如果by为一个由标签(索引)构成的列表,那么就可以依次根据列表中的元素来分组:
>>>df.groupby(['Grade','Gender'])['Weight'].mean()
Grade      Gender
Freshman   Female    48.128205
           Male      75.500000
Junior     Female    48.609756
           Male      69.928571
Senior     Female    47.800000
           Male      74.647059
Sophomore  Female    46.300000
           Male      70.454545
Name: Weight, dtype: float64
如果像按照满足某种复杂逻辑来分组,便可以指定by为一bool Series:

然而因为布尔值只有真和假,这样只能分出两个组,如果要按体重分出高、中、低三个组,用上面这种方法的话大概要分两次(先分出高和中低,再从中低分出中和低)。所以我想是不是先生成一个体重高、中、低的序列,然后根据这个序列来分组比较好。
>>>q25 = df.Weight.quantile(.25)
>>>q75 = df.Weight.quantile(.75)
>>>f = lambda x: (x<=q25) * 1 + (q25 < x < q75) * 2 + (x>=q75)*3
>>>weight_class = df.Weight.apply(f)
>>>weight_class[:15]
0     1
1     3
2     3
3     1
4     3
5     2
6     2
7     2
8     2
9     0
10    3
11    1
12    2
13    2
14    2
Name: Weight, dtype: int64
这样就对每个学生的体重定制了一个标签,第9个学生是0,这是因为他的体重缺失,而NaN与任何数比大小结果都是False,即0,所以这边就是0。
>>>df.groupby(weight_class)['Height'].mean()
Weight
0    165.144444
1    154.119149
2    162.174699
3    174.511364
Name: Height, dtype: float64
可以看出一个趋势:体重越大的人往往身高也越高。
4.1.3、groupby对象
gb = df.groupby(['School','Gender'])
groupby对象*有很多好用的方法与方便的属性。
gb.ngroups属性可以查看分组的数目gb.groups属性返回一个由组名(分组依据)映射到组索引列表(Index对象)的字典。
>>>for key, val in gb.groups.items():
       print(key)
       print(val)
       break
('Fudan University', 'Female')
Int64Index([  3,  15,  26,  28,  37,  39,  46,  49,  52,  63,  68,  70,  77,
             84,  90, 105, 107, 108, 112, 129, 138, 144, 145, 157, 170, 173,
            186, 187, 189, 195],
           dtype='int64')
gb.size()方法可以获取每组成员个数,用gb.count()[任意列]也可实现这个功能。
>>>tmp1 = gb.size()
>>>tmp2 = gb.count()['Gender']
>>>tmp2
School                         Gender
Fudan University               Female    30
                               Male      10
Peking University              Female    22
                               Male      12
Shanghai Jiao Tong University  Female    41
>>>tmp2.equals(tmp1)
True
gb.get_groups((ind1, ind2))方法可以获取(ind1,ind2)这个组的所有成员的行,类似于一个多级索引,ind1在第一层,ind2在第二层。
>>>gb.get_group(('Peking University','Female')).tail()
                School     Grade  ...   Test_Date Time_Record
140  Peking University  Freshman  ...  2019/11/30     0:05:27
159  Peking University    Junior  ...    2019/9/2     0:03:53
183  Peking University    Junior  ...  2019/10/17     0:05:20
185  Peking University  Freshman  ...  2019/12/10     0:04:24
194  Peking University    Senior  ...   2019/12/3     0:05:08
[5 rows x 10 columns]
4.1.4、分组的三大操作
| 操作 | 函数 | 返回值类型 | 举例 |
|---|---|---|---|
| 聚合 | agg | 标量scalar | 求均值、中位数 |
| 变换 | transform | 序列Series | 对某列作标准化 |
| 过滤 | filter | 表DataFrame | 筛选出符合条件的组 |
4.2、聚合函数
4.2.1、内置聚合函数
| 操作/欲获取 | 函数 | 操作/欲获取 | 函数 |
|---|---|---|---|
| 均值 | mean | 中位数 | median |
| 最大值 | max | 最小值 | min |
| 最大值索引 | idxmax | 最小值索引 | idxmin |
| 方差 | var | 标准差 | std |
| 某组成员总数 | count | 某组不重复值的个数 | nunique |
| 是否全部成员为True | all | 是否存在成员为True | any |
| 平均偏差 | mad | 偏度* | mad |
| 求和 | sum | 求积 | prod |
| 百分位数 | quantile | 无偏标准误差 | sem |
| 求每组成员数 | size |
4.2.2、agg方法
- 使用多个函数——用列表的形式把内置聚合函数对应的字符串传入
>>>gb.agg(['mean','median','std'])
                                          Height          ... Test_Number
                                            mean  median  ...      median       std
School                        Gender                      ...
Fudan University              Female  158.776923  159.10  ...           2  0.626062
                              Male    174.212500  175.95  ...           1  0.707107
Peking University             Female  158.666667  159.90  ...           2  0.767297
                              Male    172.030000  171.00  ...           1  0.792961
Shanghai Jiao Tong University Female  159.122500  159.15  ...           2  0.799390
                              Male    176.760000  176.40  ...           1  0.629153
Tsinghua University           Female  159.753333  160.70  ...           1  0.683843
                              Male    171.638889  170.40  ...           2  0.783764
[8 rows x 9 columns]
“此时的列索引为多级索引,第一层为数据源,第二层为使用的聚合方法。”
- 对特定的列使用特定的聚合函数——传入字典,键为列名,值为欲进行的操作对应的字符串(如有多个操作,则为相应列表)
例如使用字典实现上一个代码片里的类似操作:
>>>methods = ['sum','idxmax','skew']
>>>gb.agg({'Weight':methods,'Height':methods})
                                      Weight         ... Height
                                         sum idxmax  ... idxmax      skew
School                        Gender                 ...
Fudan University              Female  1437.0     28  ...     28  0.093769
                              Male     723.0     66  ...     48 -1.169826
Peking University             Female   933.0     75  ...     75 -0.174257
                              Male     737.0     38  ...     38  0.702021
Shanghai Jiao Tong University Female  1795.0     64  ...     64 -0.405679
                              Male    1140.0      2  ...      2  0.153731
Tsinghua University           Female  2304.0     14  ...     55 -0.169096
                              Male    1329.0     40  ...    193  0.974132
[8 rows x 6 columns]
- 使用自定义函数
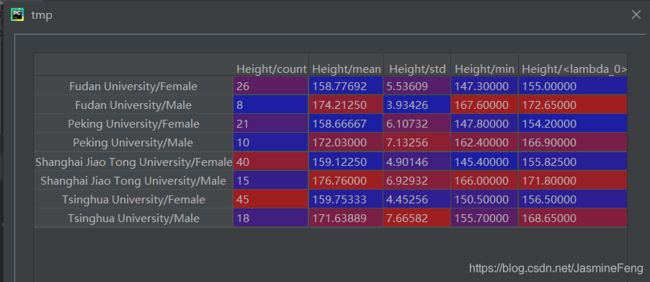
使用自定义函数实现describe方法的功能:
>>>q25 = lambda x:x.quantile(.25)
>>>q75 = lambda x:x.quantile(.75)
>>>methods = ['count','mean','std','min',q25,'median',q75,'max']
>>>tmp = gb.agg({'Height':methods,'Weight':methods})
- 一开始我是打算把
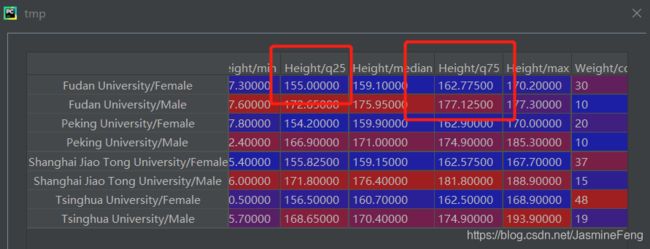
'quantile(.75)','quantile(.25)'这两个字符串传入列表的,但发现会报错,无奈下只好新定义两个函数,但这时就不能再传入'q25','q75'这两个字符串了,因为Series是没有这两个方法的!只能直接传函数。 - 我本来给四分位数的名字是q25, q75,但是在tmp这个变量里显示为了
, ,这让我很不爽,所以下面我就要对它们重命名!
-
聚合结果重命名——{字典[列表(元组)]}
基本格式,元组嵌套于列表,列表嵌套于字典:
gb.agg({'col_1':[(func1_name,func1),(func2_name,func2)],'col_2':[(func3_name,func3),(func4_name,func4)]})
改写上节代码片:
>>>methods = ['count','mean','std','min',('q25',q25),'median',('q75',q75),'max']
>>>tmp = gb.agg({'Height':methods,'Weight':methods})
4.3 、变换和过滤
4.3.1、变换函数与transform方法
- 累计函数
变换函数的返回值为同长度的序列,最常用的内置变换函数是累计函数:cumcount/cumsum/cumprod/cummax/cummin
>>>gb.cumcount()[:10]
0    0
1    0
2    0
3    0
4    0
5    0
6    1
7    1
8    2
9    0
dtype: int64

gb是按照学校和性别来分组的,第0个到第5个学生的学校和性别都不同时相同,等到第6个时,发现她跟第0位是一样的,所以cumcount返回的序列中第6个就是1。也就是说cumcount方法统计的是当前成员在其组别中是第几个(从0开始)。
依此类推,*cummax(cummin)*方法返回的是统计到当前成员时,某统计量在其组别中的最大(小)值,*cumsum(cumprod)*返回的是统计到当前成员时,某统计量在其组别中的累和(积)。
而这就是这类函数被称为“累计函数”的原因。
- rank方法
rank方法的功能就是返回一个组内当前成员的某特征的排名,这个方法一个最大的特点就是他有各种各样的method。

下面这段对rank的讲解参考了这篇博客
我们在排序的时候遇到的一个常见的状况是:有两个人“分数”是一模一样的,这个时候我到底是把这两位算同一个名次还是不同的名次呢,如果是算作同一个名次的话,那么排在他们后面那个同学是算第二名还是第三名呢。不同的场合有不同的要求,由此就有了各种方法,有
- 用平均值作为最终名次,即这两个人都是第 ( 1 + 2 ) / 2 = 1.5 名 (1+2)/2=1.5名 (1+2)/2=1.5名;
- 用最小值作为最终名次,即这两个人都是第 min { 1 , 2 } = 1 \min\{1,2\}=1 min{1,2}=1名,且后面那个同学是第3名;
- 用最大值作为最终名次,即这两个人都是第 max { 1 , 2 } = 2 \max\{1,2\}=2 max{1,2}=2名,且后面那个同学是第3名;
- 用出现顺序作为最终名次,即第一位出现算第1名,第二位出现算第2名;
- 用最小值作为最终名次,即这两个人都是第 min { 1 , 2 } = 1 \min\{1,2\}=1 min{1,2}=1名,且后面那个同学是第2名;
上面这五种方法,分别对应了average, min, max, first, dense。
- 自定义变换——transform方法
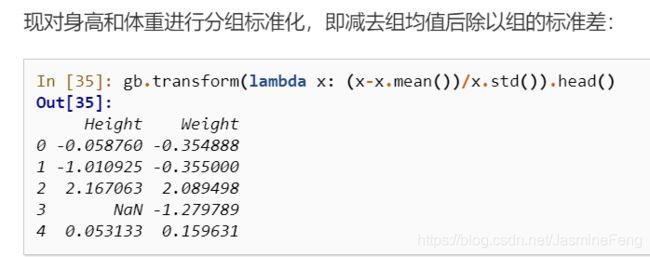
该方法就好像是在每个group内调用apply方法,以进行我们自定义的变换,如组内z-score标准化:


这个我是真的不会,试了好几种方案都报错了,然后我只好贴出来群里一位大佬的解答,咱也不知道怎么艾特他。。。
>>>def my_func(method_dict):
    def my_(x):
        method = method_dict[x.name]
        if method == 'zscore':
            return (x - x.mean()) / x.std()
        elif method == 'max':
            return x.max()
    return my_
>>>gb = df.groupby('Gender')['Height','Weight']
>>>gb.transform(my_func({'Height': 'zscore', 'Weight': 'max'}))
     Height  Weight
0 -0.058760    63.0
1 -1.010925    89.0
2  2.167063    89.0
3       NaN    63.0
4  0.053133    89.0
这段代码要想看明白对我这个小白还不太容易!有一个函数嵌套,大概的流程,差不多是先找到当前列,获取列名,然后根据列名(字典的键)确定要执行的操作(字典的值),然后指针移动到下一列,获取列名……这样迭代。(应该是吧)。
transform方法还具有广播机制,像mean本来返回的是一个均值标量,但是跟transform结合后均值就会广播到整个组的序列。

4.3.2、组索引与过滤
过滤在分组中是对于组的过滤,而索引是对于行的过滤。二者的共性是本质上都是对于行的筛选,联系是组过滤是行过滤的推广。
过滤可以用filter方法实现,但是只能筛选出符合条件的组,并不能筛选出符合条件的行。比如说,不能用groupby对象筛选出体重大于50公斤的学生。
>>>gb.filter(lambda x:x['Weight']>55)
TypeError: filter function returned a Series, but expected a scalar bool
报错显示lambda表达式期望得到一个bool标量,实际却得到一个bool Series。
用groupby对象倒是可以筛选出全体成员体重大于50公斤的组。
>>>gb.filter(lambda x:(x['Weight'].dropna()>50).all()).head()
    Weight  Height
1     70.0   166.5
2     89.0   188.9
4     74.0   174.0
10    74.0   174.1
16    68.0   170.1
注意这边还得把缺失值扔掉,不然会返回一个空序列。

这个说实话我也没啥思路,参考了一下这位大哥的
>>>indices = [1,3,6,10,15,21]
>>>gb1 = df.groupby(df.index.isin(indices))
>>>out = gb1.filter(lambda x:x.name)
>>>out
                           School      Grade  ...   Test_Date Time_Record
1               Peking University   Freshman  ...    2019/9/4     0:04:20
3                Fudan University  Sophomore  ...    2020/1/3     0:04:08
6   Shanghai Jiao Tong University   Freshman  ...  2019/12/12     0:03:53
10  Shanghai Jiao Tong University   Freshman  ...   2019/9/29     0:05:16
15               Fudan University   Freshman  ...    2020/1/1     0:05:25
21  Shanghai Jiao Tong University     Senior  ...    2020/1/2     0:04:54
[6 rows x 10 columns]
不过我总觉这方法怪怪的,哪里不对劲,毕竟我按照是否在indices来分组后,一共就只有两个组了,还需要用filter过滤吗?直接get_group就好了呀
>>>gb1.get_group(True)
                           School      Grade  ...   Test_Date Time_Record
1               Peking University   Freshman  ...    2019/9/4     0:04:20
3                Fudan University  Sophomore  ...    2020/1/3     0:04:08
6   Shanghai Jiao Tong University   Freshman  ...  2019/12/12     0:03:53
10  Shanghai Jiao Tong University   Freshman  ...   2019/9/29     0:05:16
15               Fudan University   Freshman  ...    2020/1/1     0:05:25
21  Shanghai Jiao Tong University     Senior  ...    2020/1/2     0:04:54
[6 rows x 10 columns]
4.4、跨列分组
4.4.1、apply操作的引入

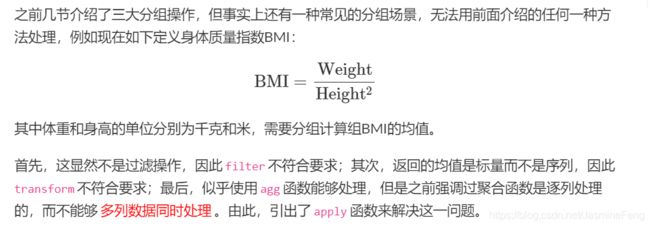
这边就直接COPY+PASTE了。正所谓有需求才会有改进,为了满足新的需要,特此引入了groupby对象的apply操作。
4.4.2、apply的使用
>>>def my_bmi(x):
    h = x['Height']/100
    w = x['Weight']
    bmi = w/h**2
    return bmi.mean()


>>>gb.apply(my_bmi)
Gender
Female    18.860930
Male      24.318654
dtype: float64
- 函数返回标量,apply返回Series
>>>g1 = (i for i in 'abcdef')  # 生成器推导式
>>>gb.apply(lambda x:next(g1))
Gender  Test_Number
Female  1              a
        2              b
        3              c
Male    1              d
        2              e
        3              f
dtype: object
以上的'a','b','c','d','e','f'分别是我在6次生成器迭代时产生的标量(这边标量不一定是数值,是广义的,你懂的),6个标量构成了一个序列。
- 函数返回Series,apply返回DF
>>>l3 = [i for i in zip(list('acegik'),list('bdfhjl'))]
>>>l3
[('a', 'b'), ('c', 'd'), ('e', 'f'), ('g', 'h'), ('i', 'j'), ('k', 'l')]
>>>it = iter(l3)
>>>gb.apply(lambda x:pd.Series(next(it),index=('x','y')))
                    x  y
Gender Test_Number
Female 1            a  b
       2            c  d
       3            e  f
Male   1            g  h
       2            i  j
       3            k  l
以上每一行的字母都是我每一次迭代所产生的Series,这些Series纵向拼接就形成了一个DF。

这边返回不同索引的话,我再用一次迭代器好了:
>>>it = iter(l3)
>>>gb.apply(lambda x:pd.Series([0,1],index=next(it)))
TypeError: Series.name must be a hashable type
确实报错了,但我也不知道原因是啥。。。
- 函数返回DF,apply返回更大的DF
from string import ascii_lowercase as al

>>>l4 = [[[a,b],[c,d]] for a,b,c,d in zip(al[:24:4],al[1:24:4],al[2:24:4],al[3:24:4])]
>>>it = iter(it)
>>>gb.apply(lambda x:pd.DataFrame(next(it),columns=['1','2'],index=['yy','zz']))
                       1  2
Gender Test_Number
Female 1           yy  a  b
                   zz  c  d
       2           yy  e  f
                   zz  g  h
       3           yy  i  j
                   zz  k  l
Male   1           yy  m  n
                   zz  o  p
       2           yy  q  r
                   zz  s  t
       3           yy  u  v
                   zz  w  x
>>>it_l3 = iter(l3)
>>>gb.apply(lambda x:pd.DataFrame([[0,1],[2,3]],columns=next(it_l3),index=['yy','zz']))
                         a    b    c    d    e  ...    h    i    j    k    l
Gender Test_Number                              ...
Female 1           yy  0.0  1.0  NaN  NaN  NaN  ...  NaN  NaN  NaN  NaN  NaN
                   zz  2.0  3.0  NaN  NaN  NaN  ...  NaN  NaN  NaN  NaN  NaN
       2           yy  NaN  NaN  0.0  1.0  NaN  ...  NaN  NaN  NaN  NaN  NaN
                   zz  NaN  NaN  2.0  3.0  NaN  ...  NaN  NaN  NaN  NaN  NaN
       3           yy  NaN  NaN  NaN  NaN  0.0  ...  NaN  NaN  NaN  NaN  NaN
                   zz  NaN  NaN  NaN  NaN  2.0  ...  NaN  NaN  NaN  NaN  NaN
Male   1           yy  NaN  NaN  NaN  NaN  NaN  ...  1.0  NaN  NaN  NaN  NaN
                   zz  NaN  NaN  NaN  NaN  NaN  ...  3.0  NaN  NaN  NaN  NaN
       2           yy  NaN  NaN  NaN  NaN  NaN  ...  NaN  0.0  1.0  NaN  NaN
                   zz  NaN  NaN  NaN  NaN  NaN  ...  NaN  2.0  3.0  NaN  NaN
       3           yy  NaN  NaN  NaN  NaN  NaN  ...  NaN  NaN  NaN  0.0  1.0
                   zz  NaN  NaN  NaN  NaN  NaN  ...  NaN  NaN  NaN  2.0  3.0
[12 rows x 12 columns]
只是列索引不同确实没报错,但是有很多缺失值,这个很好理解,因为列索引变了。
>>>it_l3 = iter(l3)
>>>gb.apply(lambda x:pd.DataFrame([[0,1],[2,3]],columns=['yy','zz'],index=next(it_l3)))
                      yy  zz
Gender Test_Number
Female 1           a   0   1
                   b   2   3
       2           c   0   1
                   d   2   3
       3           e   0   1
                   f   2   3
Male   1           g   0   1
                   h   2   3
       2           i   0   1
                   j   2   3
       3           k   0   1
                   l   2   3
诶嘿,这次也没报错,也很好理解,因为行索引变了。
我再来试试如果列和行索引都改变呢。
>>>l4 = [[i+'_row',j+'_row'] for i,j in zip(list('acegik'),list('bdfhjl'))]
>>>l5 = [[i+'_col',j+'_col'] for i,j in zip(list('acegik'),list('bdfhjl'))]
>>>it_l4 = iter(l4)
>>>it_l5 = iter(l5)
>>>gb.apply(lambda x:pd.DataFrame([[0,1],[2,3]],columns=next(it_l5),index=next(it_l4)))

                          a_col  b_col  c_col  ...  j_col  k_col  l_col
Gender Test_Number                             ...
Female 1           a_row    0.0    1.0    NaN  ...    NaN    NaN    NaN
                   b_row    2.0    3.0    NaN  ...    NaN    NaN    NaN
       2           c_row    NaN    NaN    0.0  ...    NaN    NaN    NaN
                   d_row    NaN    NaN    2.0  ...    NaN    NaN    NaN
       3           e_row    NaN    NaN    NaN  ...    NaN    NaN    NaN
                   f_row    NaN    NaN    NaN  ...    NaN    NaN    NaN
Male   1           g_row    NaN    NaN    NaN  ...    NaN    NaN    NaN
                   h_row    NaN    NaN    NaN  ...    NaN    NaN    NaN
       2           i_row    NaN    NaN    NaN  ...    1.0    NaN    NaN
                   j_row    NaN    NaN    NaN  ...    3.0    NaN    NaN
       3           k_row    NaN    NaN    NaN  ...    NaN    0.0    1.0
                   l_row    NaN    NaN    NaN  ...    NaN    2.0    3.0
[12 rows x 12 columns]
原来都不报错啊,只有函数返回Series的情况下会报错。

这段话在告诉我们,能用别人写好的框架,就少自己造轮子~好在不过我也不是这种喜欢造轮子的人(哪里不对?)。

好家伙,于是这道题就让我自己造轮子了。
def my_cov(x):
    x = x.dropna()
    x1 = x['Height']
    x2 = x['Weight']
    xx = np.c_[x1,x2]
    xx = xx - xx.mean(axis=0)
    sample_size = xx.shape[0]
    cov = xx.T.dot(xx) / (sample_size)  # 分母sample_size-1等价于ddof=1
    # cov = np.cov(xx.T,ddof=0)
    df = pd.DataFrame(cov,index=['Height','Weight'],columns=['Height','Weight'])
    return df

>>>print(gb.apply(lambda x: my_cov(x)))
                              Height     Weight
Gender Test_Number
Female 1           Height  21.519456  21.094500
                   Weight  21.094500  26.514167
       2           Height  31.168056  29.753125
                   Weight  29.753125  35.016927
       3           Height  22.438395  19.645679
                   Weight  19.645679  22.913580
Male   1           Height  43.292384  46.834400
                   Weight  46.834400  59.360000
       2           Height  53.872747  36.100617
                   Weight  36.100617  35.765432
       3           Height  55.741600  67.216000
                   Weight  67.216000  85.360000
>>>gb.cov()
                              Height     Weight
Gender Test_Number
Female 1           Height  20.963600  21.452034
                   Weight  21.452034  26.438244
       2           Height  31.615680  30.386170
                   Weight  30.386170  34.568250
       3           Height  23.582395  20.801307
                   Weight  20.801307  23.228070
Male   1           Height  42.638234  48.785833
                   Weight  48.785833  67.669951
       2           Height  57.041732  38.224183
                   Weight  38.224183  37.869281
       3           Height  56.157667  84.020000
                   Weight  84.020000  89.904762
我调整了自由度,发现还是跟gb.cov()算出来的不一致
%timeit -n 100 gb.cov()
4.55 ms ± 99.7 µs per loop (mean ± std. dev. of 7 runs, 100 loops each)
%timeit -n 100 gb.apply(lambda x:my_cov(x))
9.49 ms ± 82.8 µs per loop (mean ± std. dev. of 7 runs, 100 loops each)
性能差得还是挺大的!
4.5、练习
4.5.1汽车数据集
>>>df = pd.read_csv('E:\\DataWhale组队学习\\data\\car.csv')
>>>country_count = df['Country'].value_counts()
>>>country_list = country_count[country_count > 2].index
>>>country_list
Index(['USA', 'Japan', 'Japan/USA', 'Korea'], dtype='object')
>>>df1 = df[df.Country.isin(country_list)]
>>>gb_country = df1.groupby('Country')[['Price']]
>>>cv = lambda x:x.std()/x.mean()
>>>gb_country.agg(['mean','size',('Cov',cv)])
                  Price
                   mean size       Cov
Country
Japan      13938.052632   19  0.387429
Japan/USA  10067.571429    7  0.240040
Korea       7857.333333    3  0.243435
USA        12543.269231   26  0.203344
答案用了groupby对象的filter方法,把不符合条件的组给剔除了,但是题目不是说先剔除再分组嘛,以至于我就没有想到能用filter,有点死板哈~
![]()
>>>data_size = df.shape[0]
>>>tag = pd.Series(int(data_size/3)*['a']+(int(data_size/3*2)-int(data_size/3))*['b']+(data_size-int(data_size/3*2))*['c'])
>>>df2 = df.copy()
>>>df2.loc[:,'tag'] = tag  # 1
>>>gb_index = df2.groupby('tag')['Price']
>>>gb_index.mean()
tag
a     9069.95
b    13356.40
c    15420.65
Name: Price, dtype: float64
答案跟我的思路是差不多的,我这边1处是没有必要的,无需把tag列添加到df中,直接用tag这个Series甚至是列表都可以进行分组,pandas在这方面还是很灵活的。

>>>gb_type = df.groupby('Type')['Price','HP']
>>>tmp = gb_type.agg(['max','min'])
>>>tmp
         Price          HP
           max    min  max  min
Type
Compact  18900   9483  142   95
Large    17257  14525  170  150
Medium   24760   9999  190  110
Small     9995   5866  113   63
Sporty   13945   9410  225   92
Van      15395  12267  150  106
>>>tmp.columns
MultiIndex([('Price', 'max'),
            ('Price', 'min'),
            (   'HP', 'max'),
            (   'HP', 'min')],
>>>tmp.columns.map(lambda x:'_'.join(x))
Index(['Price_max', 'Price_min', 'HP_max', 'HP_min'], dtype='object')
>>>tmp.columns = _
>>>tmp
         Price_max  Price_min  HP_max  HP_min
Type
Compact      18900       9483     142      95
Large        17257      14525     170     150
Medium       24760       9999     190     110
Small         9995       5866     113      63
Sporty       13945       9410     225      92
Van          15395      12267     150     106
>>>minmaxmap = lambda x:(x-x.min())/(x.max()-x.min())
>>>gb_type.transform(minmaxmap).head()
     HP
0  1.00
1  0.54
2  0.00
3  0.58
4  0.80
>>>gb_type = df.groupby('Type')[['Disp.','HP']]
>>>gb_type.corr()
                  Disp.        HP
Type
Compact Disp.  1.000000  0.586087
        HP     0.586087  1.000000
Large   Disp.  1.000000 -0.242765
        HP    -0.242765  1.000000
Medium  Disp.  1.000000  0.370491
        HP     0.370491  1.000000
Small   Disp.  1.000000  0.603916
        HP     0.603916  1.000000
Sporty  Disp.  1.000000  0.871426
        HP     0.871426  1.000000
Van     Disp.  1.000000  0.819881
        HP     0.819881  1.000000
>>>gb_type.apply(lambda x:np.corrcoef(x['Disp.'].values,x['HP'].values)[0,1])
Type
Compact    0.586087
Large     -0.242765
Medium     0.370491
Small      0.603916
Sporty     0.871426
Van        0.819881
dtype: float64
注意题目要求的是相关系数,不是相关系数矩阵。从矩阵取数的时候,由于该矩阵的实对称性,位置用[0,1]或者[1,0]是等价的。
4.5.2、实现transform函数
class my_groupby:
    def __init__(self, my_df, group_cols):
        self.my_df = my_df.copy()
        self.groups = my_df[group_cols].drop_duplicates()
        if isinstance(self.groups, pd.Series):
            self.groups = self.groups.to_frame()
        self.group_cols = self.groups.columns.tolist()
        self.groups = {i: self.groups[i].values.tolist() for i in self.groups.columns}
        self.transform_col = None

    def __getitem__(self, col):  # 取值时自动调用
        self.pr_col = [col] if isinstance(col, str) else list(col)
        return self

    def transform(self, my_func):
        self.num = len(self.groups[self.group_cols[0]])
        L_order, L_value = np.array([]), np.array([])
        for i in range(self.num):  # i是组别
            group_df = self.my_df.reset_index().copy()  # 如果有人为设定的索引,恢复为默认索引
            for col in self.group_cols:  # 根据顺序迭代筛选出当前组
                group_df = group_df[group_df[col] == self.groups[col][i]]
            group_df = group_df[self.pr_col]  # 筛出要计算的列
            if group_df.shape[1] == 1:
                group_df = group_df.iloc[:, 0]  # 如果group_df只有一列,就设Series
            group_res = my_func(group_df)
            if not isinstance(group_res, pd.Series):
                group_res = pd.Series(group_res, index=group_df.index, name=group_df.name)
            L_order = np.r_[L_order, group_res.index]  # 拼接不同组索引
            L_value = np.r_[L_value, group_res.values]
        self.res = pd.Series(pd.Series(L_value, index=L_order).sort_index().values,
                             index=self.my_df.reset_index().index, name=my_func.__name__)
        return self.res


