深蓝学院第二章:基于全连接神经网络(FCNN)的手写数字识别
如何用全连接神经网络去做手写识别???
使用的是jupyter notebook这个插件进行代码演示。(首先先装一个Anaconda的虚拟环境,然后自己构建一个自己的虚拟环境,然后在虚拟环境中安装jupyter、安装我们将要使用的一些包)
安装参考步骤:https://blog.csdn.net/m0_37957160/article/details/114153355
手写数字识别输入是图片,建立一种全连接神经网络的模型来将手写数字进行识别。手写数字识别是一个![]() 的图片,实际上我们神经网络的输入层只能处理这种一维的数据,这里
的图片,实际上我们神经网络的输入层只能处理这种一维的数据,这里![]() 的我们按照行或者按照列给他展开,相当于把它展成一个784这样的一个向量,然后再输入到这个全连接神经网络当中。这里让全连接神经网络的输入层有784个神经元,再加上一个偏置b,中间层可以按照自己的实验去设置一个数值,比如说中间层有30或者20个神经元,这个输出层有10个,分别代表的是0到9。
的我们按照行或者按照列给他展开,相当于把它展成一个784这样的一个向量,然后再输入到这个全连接神经网络当中。这里让全连接神经网络的输入层有784个神经元,再加上一个偏置b,中间层可以按照自己的实验去设置一个数值,比如说中间层有30或者20个神经元,这个输出层有10个,分别代表的是0到9。
全连接神经网络:

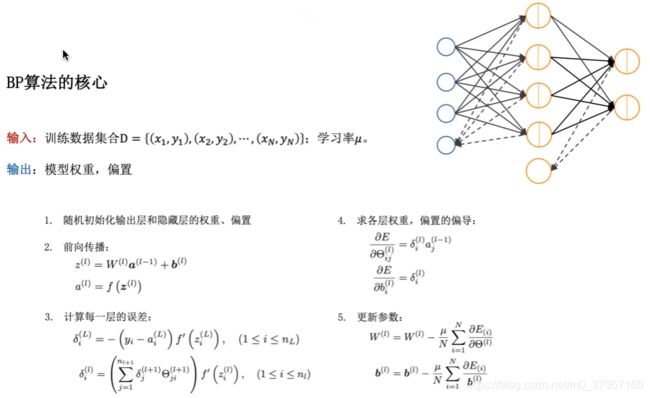 在计算每一层误差的时候
![]() 就代表我整个的从
就代表我整个的从![]() 层到
层到![]() 层误差反传的时候他有一个权重矩阵的转置在这里面。
层误差反传的时候他有一个权重矩阵的转置在这里面。
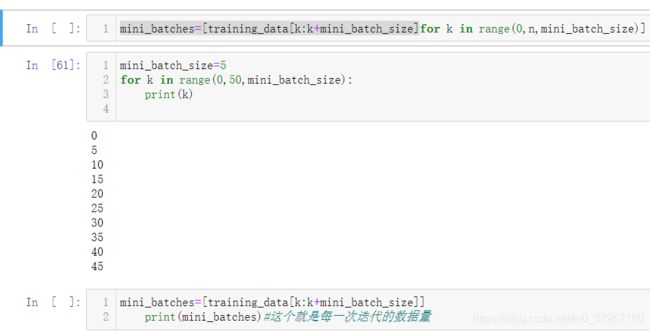
使用的是Minist batch的一个梯度下降算法,并不是一次把所有的数据都放进去进行学习,而是每一次我选择里边一部分数据集进行学习,他的输出就是我整个的模型,包括权重和偏置。
代码中使用到的python知识:
1、python中cPickle用法:
有些training set 数据是用.pkl 文件存储的。用module cPickle读取非常方便。
cPickle模块:
在python中,一般可以使用pickle类来进行python对象序列化,而cPickle提供了一个更快速简单的接口,如python文档所说:“cPickle - A faster pickle”。
cPickle可以对任意一种类型的python对象进行序列化操作,比如:list, dict,甚至是一个类的对象等。而所谓的序列化,是为了能完整地保存并能够完全可逆的恢复。在cPickle中,主要有4个函数:
1.1 dump:将python对象序列化保存到本地的文件
import _pickle as cPickle

data = range(1000)#range() 函数可创建一个整数列表,0到999是没有1000。
cPickle.dump(data, open("test\\data.pkl", "wb"))
dump函数需要指定两个参数,第一个是需要序列化的python对象名称,第二个是本地的文件,需要注意的是,在这里需要使用open函数打开一个文件,并指定“写”操作。
1.2. load:载入本地文件,恢复python对象
data = cPickle.load(open("test\\data.pkl", "rb"))使用open函数打开本地的一个文件,并指定“读”操作。
1.3. dumps:将python对象序列化保存到一个字符串变量中
data_string = cPickle.dumps(data)1.4. loads:载入字符串,恢复python对象
data = cPickle.loads(data_string)pickle与cpickle比较:https://www.cnblogs.com/keye/p/8779626.html
pickle完全用python来实现的,cpickle用C来实现的,cpickle的速度要比pickle快好多倍。
2、numpy.reshape(a, newshape, order='C')[source],参数`newshape`是啥意思?
根据Numpy文档:https://numpy.org/doc/stable/reference/generated/numpy.reshape.html#numpy-reshape
newshape : int or tuple of ints
The new shape should be compatible with the original shape. If an integer, then the result will be a 1-D array of that length. One shape dimension can be -1. In this case, **the value is inferred from the length of the array and remaining dimensions**.
大意是说,数组新的shape属性应该要与原来的配套,如果等于-1的话,那么Numpy会根据剩下的维度计算出数组的另外一个shape属性值。
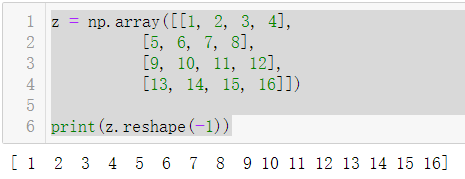
举几个例子或许就清楚了,有一个数组z,它的shape属性是(4, 4)
z = np.array([[1, 2, 3, 4],
          [5, 6, 7, 8],
          [9, 10, 11, 12],
          [13, 14, 15, 16]])
print(z.shape)#输出(4, 4)

变量名.reshape(m,n),返回一个m行n列的数组
变量名.reshape(-1),返回一个一维数组
变量名.reshape(-1,n),返回一个n列的数组,行数自动给定
3、python 自定义向量化(vectorized)操作函数
4、np.zeros函数的作用
返回来一个给定形状和类型的用0填充的数组;
numpy.zeros(shape,dtype=float,order = 'C')
shape:形状
dtype:数据类型,可选参数,默认numpy.float64
order:可选参数,c代表与c语言类似,行优先;F代表列优先
np.zeros(5)
Out[1]: array([ 0.,  0.,  0.,  0.,  0.])
import numpy as np
print(np.zeros((2,5)))结果为一个2行5列的矩阵
[[0. 0. 0. 0. 0.]
[0. 0. 0. 0. 0.]]
print(np.zeros((2,5),dtype= np.int))结果为
[[0 0 0 0 0]
[0 0 0 0 0]]
5、plt.subplot()使用方法以及参数介绍
首先一幅Matplotlib的图像组成部分介绍。:https://blog.csdn.net/asher117/article/details/85128463
在matplotlib中,整个图像为一个Figure对象。在Figure对象中可以包含一个或者多个Axes对象。每个Axes(ax)对象都是一个拥有自己坐标系统的绘图区域。所属关系如下:
def subplots(nrows=1, ncols=1, sharex=False, sharey=False, squeeze=True,
             subplot_kw=None, gridspec_kw=None, **fig_kw):
参数
nrows,ncols:
子图的行列数。
sharex, sharey:
设置为 True 或者 ‘all’ 时,所有子图共享 x 轴或者 y 轴,
设置为 False or ‘none’ 时,所有子图的 x,y 轴均为独立,
设置为 ‘row’ 时,每一行的子图会共享 x 或者 y 轴,
设置为 ‘col’ 时,每一列的子图会共享 x 或者 y 轴。
squeeze:
默认为 True,是设置返回的子图对象的数组格式。
当为 False 时,不论返回的子图是只有一个还是只有一行,都会用二维数组格式返回他的对象。
当为 True 时,如果设置的子图是(nrows=ncols=1),即子图只有一个,则返回的子图对象是一个标量的形式,如果子图有(N×1)或者(1×N)个,则返回的子图对象是一个一维数组的格式,如果是(N×M)则是返回二位格式。
subplot_kw:
字典格式,传递给 add_subplot() ,用于创建子图。
gridspec_kw:
字典格式,传递给 GridSpec 的构造函数,用于创建子图所摆放的网格。
class matplotlib.gridspec.GridSpec(nrows, ncols, figure=None, left=None, bottom=None, right=None, top=None, wspace=None, hspace=None, width_ratios=None, height_ratios=None)
如,设置 gridspec_kw={'height_ratios': [3, 1]} 则子图在列上的分布比例是3比1。
**fig_kw :
所有其他关键字参数都传递给 figure()调用。
如,设置 figsize=(21, 12) ,则设置了图像大小。
返回值
fig: matplotlib.figure.Figure 对象
ax:子图对象( matplotlib.axes.Axes)或者是他的数组
在用plt.subplots画多个子图中,ax = ax.flatten()将ax由n*m的Axes组展平成1*nm的Axes组。ax是在画布上添加的子图
以下面的例子说明ax = ax.flatten()的作用:
fig, ax = plt.subplots(nrows=2,ncols=2,sharex='all',sharey='all')
ax = ax.flatten()

for i in range(4):
    img = image[i].reshape(28, 28)
    ax[i].imshow(img, cmap='Greys', interpolation='nearest')  # 区别:可以直接用ax[i]
不使用ax = ax.flatten()
fig, ax = plt.subplots(nrows=2,ncols=2,sharex='all',sharey='all')

for i in range(4):
    img = image[i].reshape(28, 28)

    axs[0, 0].imshow(img, cmap='Greys', interpolation='nearest')  # 区别:不能直接使用ax[i]

    axs[0, 1].imshow(img, cmap='Greys', interpolation='nearest')

    axs[1, 0].imshow(img, cmap='Greys', interpolation='nearest')

    axs[1, 1].imshow(img, cmap='Greys', interpolation='nearest')
官方文档:https://matplotlib.org/stable/api/axes_api.html
https://matplotlib.org/stable/api/_as_gen/matplotlib.pyplot.subplot.html
6、format 格式化函数
Python2.6 开始,新增了一种格式化字符串的函数 str.format(),它增强了字符串格式化的功能。
基本语法是通过 {} 和 : 来代替以前的 % 。
format 函数可以接受不限个参数,位置可以不按顺序。
>>>"{} {}".format("hello", "world")    # 不设置指定位置,按默认顺序
结果输出:'hello world'

>>> "{0} {1}".format("hello", "world")  # 设置指定位置
结果输出:'hello world'

>>> "{1} {0} {1}".format("hello", "world")  # 设置指定位置
结果输出:'world hello world'
也可以设置参数:
#!/usr/bin/python
# -*- coding: UTF-8 -*-

print("网站名:{name}, 地址 {url}".format(name="菜鸟教程", url="www.runoob.com"))

# 通过字典设置参数
site = {"name": "菜鸟教程", "url": "www.runoob.com"}
print("网站名:{name}, 地址 {url}".format(**site))

# 通过列表索引设置参数
my_list = ['菜鸟教程', 'www.runoob.com']
print("网站名:{0[0]}, 地址 {0[1]}".format(my_list))  # "0" 是必须的
输出结果为:
网站名:菜鸟教程, 地址 www.runoob.com
网站名:菜鸟教程, 地址 www.runoob.com
网站名:菜鸟教程, 地址 www.runoob.com
参考:https://www.runoob.com/python/att-string-format.html
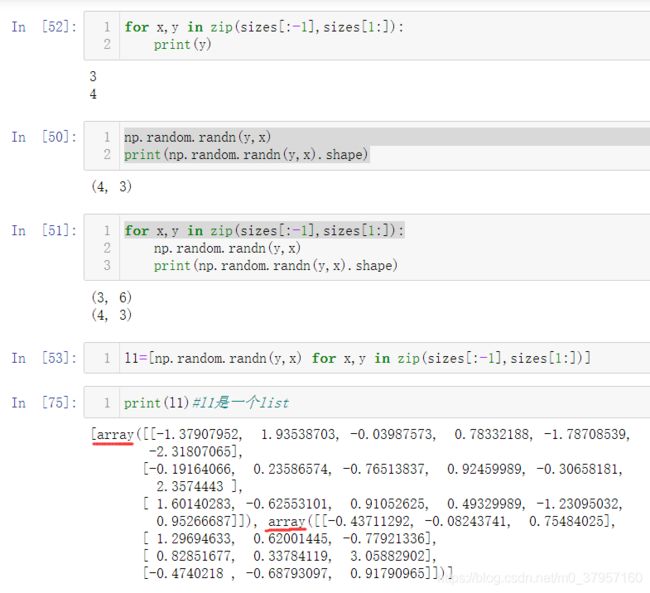
7、 numpy.random.rand()
numpy.random.rand(d0,d1,…,dn)
- rand函数根据给定维度生成[0,1)之间的数据,包含0,不包含1
- dn表格每个维度
- 返回值为指定维度的array
np.random.rand(4,2)结果:
array([[ 0.02173903,  0.44376568],
       [ 0.25309942,  0.85259262],
       [ 0.56465709,  0.95135013],
       [ 0.14145746,  0.55389458]])
np.random.rand(4,3,2) # shape: 4*3*2结果为:array([[[ 1.27820764, 0.92479163],
[-0.15151257, 1.3428253 ],
[-1.30948998, 0.15493686]],
[[-1.49645411, -0.27724089],
[ 0.71590275, 0.81377671],
[-0.71833341, 1.61637676]],
[[ 0.52486563, -1.7345101 ],
[ 1.24456943, -0.10902915],
[ 1.27292735, -0.00926068]],
[[ 0.88303 , 0.46116413],
[ 0.13305507, 2.44968809],
[-0.73132153, -0.88586716]]])参考:https://blog.csdn.net/u012149181/article/details/78913167
8、python列表的截取
 负数索引表示从右边往左数,从-1开始。最右边的元素的索引为-1,倒数第二个元素为-2。[ a:b ]包含a不包括b。
正索引从左向右,从0开始。
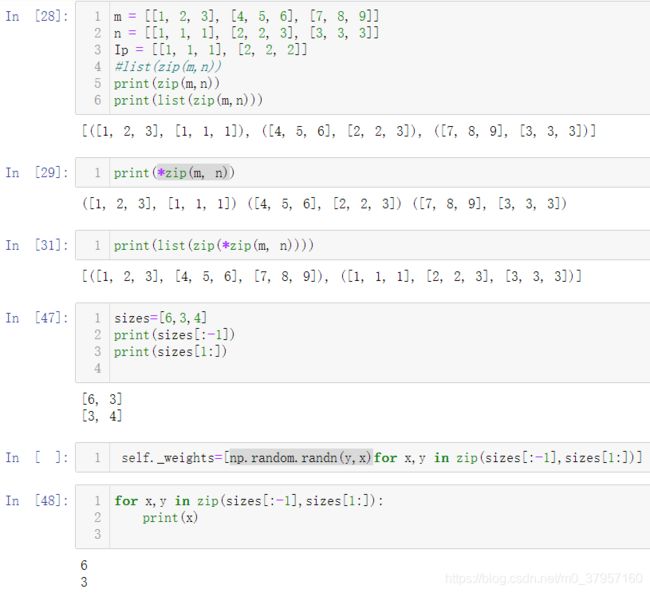
9、zip() 函数
zip() 函数用于将可迭代的对象作为参数,将对象中对应的元素打包成一个个元组,然后返回由这些元组组成的列表。
如果各个迭代器的元素个数不一致,则返回列表长度与最短的对象相同,利用 * 号操作符,可以将元组解压为列表。
10、random.shuffle()
用来乱序序列,它是在序列的本身打乱,而不是新生成一个序列
不会生成新的列表,只是将原列表的次序打乱。
PS:有关random.shuffle函数的局限性。重点: random.shuffle千万不要用于二维numpy.array(也就是矩阵)!!!
如下代码:
查看random.shuffle源码:
def shuffle(self, x, random=None):
    """Shuffle list x in place, and return None.
    原位打乱列表,不生成新的列表。

    Optional argument random is a 0-argument function returning a
    random float in [0.0, 1.0); if it is the default None, the
    standard random.random will be used.
    可选参数random是一个从0到参数的函数,返回[0.0,1.0)中的随机浮点;
	如果random是缺省值None,则将使用标准的random.random()。

    """

    if random is None:
        randbelow = self._randbelow
        for i in reversed(range(1, len(x))):
            # pick an element in x[:i+1] with which to exchange x[i]
            j = randbelow(i+1)
            x[i], x[j] = x[j], x[i]
    else:
        _int = int
        for i in reversed(range(1, len(x))):
            # pick an element in x[:i+1] with which to exchange x[i]
            j = _int(random() * (i+1))
            x[i], x[j] = x[j], x[i]
只需要关注其中交换元素操作为 x[i], x[j] = x[j], x[i]
测试一下这种交换方式对于二维numpy.array会发生什么事情:
import numpy as np
a = np.array([[1,2,3,4],
              [5,6,7,8]])
a[0], a[1] = a[1], a[0]
print(a)
输出:
[[5 6 7 8]
 [5 6 7 8]]
显然这种方式不适合numpy.array的行交换(但是二维list就可以使用这种交换方式。可以自行证明,至于原因暂时不知道,求解答)。
打乱numpy.array正确的姿势当然是使用numpy自带的numpy.random.shuffle()
def shuffle(x): # real signature unknown; restored from __doc__
"""
shuffle(x)

        Modify a sequence in-place by shuffling its contents.

        This function only shuffles the array along the first axis of a
        multi-dimensional array. The order of sub-arrays is changed but
        their contents remains the same.

        Parameters
        ----------
        x : array_like
            The array or list to be shuffled.

        Returns
        -------
        None

        Examples
        --------
        >>> arr = np.arange(10)
        >>> np.random.shuffle(arr)
        >>> arr
        [1 7 5 2 9 4 3 6 0 8]

        Multi-dimensional arrays are only shuffled along the first axis:

        >>> arr = np.arange(9).reshape((3, 3))
        >>> np.random.shuffle(arr)
        >>> arr
        array([[3, 4, 5],
               [6, 7, 8],
               [0, 1, 2]])
"""
pass
注释中Multi-dimensional arrays are only shuffled along the first axis: 多维向量只是沿着第一个坐标轴进行重新排序。
参考:https://blog.csdn.net/qq_21063873/article/details/80860218
11、range()
https://www.runoob.com/python/python-func-range.html
以下是完整的代码,包含解读,经测试是完全可以跑通的。
完整的代码下载链接:https://download.csdn.net/download/m0_37957160/15713687
---------------------------------------done----------------------
下面是一些代码解读:


