合并GEE导出分割的.tif文件,并对文件进行LZW压缩
需求分析:将多个.tif文件按照经纬度、时间/波段的维度进行合并。
一、基于python(xarray和rasterio包)
import rasterio as rio
import numpy as np
import rasterio
import matplotlib.pyplot as plt
import xarray as xr

def lzw_com(inpath1, inpath2, outpath, comstyle='lon'):

    rs = rio.open(inpath1)
    rs2 = rio.open(inpath2)    # 读入栅格文件

     # time*lat*lon    #读取栅格

    profile = rs.profile      #获取栅格信息
    print(profile)

    # 合并方式
    new_width, new_count = rs.profile['width'],rs.profile['count']
    if comstyle=='lon':
        new_width = rs.profile['width']+rs2.profile['width']
        rasterdata2 = np.concatenate([rs.read(), rs2.read()], axis=2)
    elif comstyle=='time':
        new_count = rs.profile['count']+rs2.profile['count']
        rasterdata2 = np.concatenate([rs.read(), rs2.read()], axis=0)

    print('data process over!')
    #选择压缩方式
    profile.update(
        width=new_width,  # 按维度合并
        count=new_count,
        blockxsize=256,
        blockysize=256,
        tiled=True,
        compress='lzw',  #压缩方式:rle,lzw等
        )

    #导出
    with rasterio.open(outpath, mode='w', **profile) as dst:
        dst.write(rasterdata2)

# 笔记本内存不足,上传至kaggle运行...
inpath = '/kaggle/working/AOD_2019_01-08.tif'
inpath2 = '/kaggle/input/mcd19a2-2019-tif/AOD_2019_09-12_all.tif'
outpath = '/kaggle/working/AOD_2019_01-12.tif'
lzw_com(inpath, inpath2, outpath, comstyle='time')
使用基于数据合并的方式,来合并tif,会使得生成的.tif文件过大。需要使用LZW进行无损压缩。
二、基于GDAL工具包(gdalwarp, gdalbuildvrt和gdal_translate)
环境需求:下载gdal软件名包并解压好,将相应的路径放入环境变量中,这里我按照参考文章[2]的设置。在命令行中输出gdalinfo --version进行验证。
gdalinfo --version
验证结果如下:
2.1 基于gdalwarp命令
参考[3],进行.tif所在的文件夹,右键打开命令行,直接合并两个.tif文件。
gdalwarp 1.tif 2.tif 12.tif
可行,但由于GEE导出的.tif是经过LZW压缩的,用这个代码直接拼接生成的结果偏大。需要进一步压缩。
2.2 基于gdalbulidvrt和gdal_translate命令 (推荐)
这两个命令用于处理多个.tif文件,同样在命令行:
gdalbuildvrt 1.vrt ./*.tif
gdal_translate -of gtiff 1.vrt 1.tif
同样,结果需要压缩。参考[4],得到了对多个.tif文件合并且压缩的方法:
gdalbuildvrt F:\\gdal_test\\merged.vrt F:\\gdal_test\\AOD_2019_01-04_left.tif F:\\gdal_test\\AOD_2019_01-04_right.tif
gdal_translate -co COMPRESS=LZW -co BIGTIFF=YES --config GDAL_VRT_ENABLE_PYTHON YES F:\\gdal_test\\merged.vrt F:\\gdal_test\\merged.tif
此时拼接好的文件是经过LZW压缩的。
总结:
方法一可以在时间、波段上进行拼接,但是花费的内存偏多,不是很实用;
方法二基于工具包拼接,简单快捷。但是用于我在导出GEE的时候将时间合并在了波段里,然后一年数据导出的时候时间也被切割了,所以使用方法二只能拼接同一时间(波段)、不同位置的.tif文件。(看后续能不能找到使用gda拼接波段/时间的方法)
三、实例分析
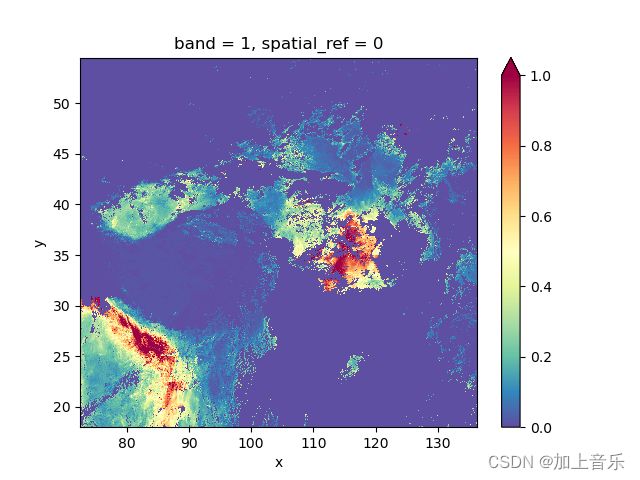
以GEE,MCD19A2 2019年数据为例,使用方法二gdal处理(命令行耗时大约8h)
处理完成后再使用python的rasterio打开,可视化:
Dir = 'F:\\2_Joint_Estimation\\Source Data\\GEE_AOD_2019_Year'
ds = rxr.open_rasterio(Dir+'/merged.tif')
print((ds[0][0]!=0).sum())  # 查看有效数值,这里以0为填充

# 以第一天为例绘图
t =ds[0]*0.001   # scale = 0.001
t.plot(cmap="Spectral_r", vmin=0, vmax=1)  # Spectral的互逆配色
plt.show()
参考文章:
[1]. python批量压缩tif文件
[2]. windows环境下安装和配置GDAL
[3]. 利用gdal把多张tif合成一张大图
[4]. GDAL将多张影像拼成一张图的最优解决方法

