前言
虽然可以使用jvisualvm之类的工具监控java项目,但是集群环境下,还是捉襟见肘,下面介绍如何用主流的prometheus来监控java项目。
java项目配置
在pom.xml中添加依赖
            org.springframework.boot
            spring-boot-starter-actuator


            io.micrometer
            micrometer-registry-prometheus
            1.5.1


            io.github.mweirauch
            micrometer-jvm-extras
            0.2.0
修改spring boot配置(application.yml)
server:
  port: 8096

spring:
  application:
    name: gift

management:
  endpoint:
    health:
      show-details: always
  endpoints:
    web:
      exposure:
        include: 'prometheus'  # 暴露/actuator/prometheus
  metrics:
    tags:
      application: ${spring.application.name}  # 暴露的数据中添加application label
非k8s下java项目监控
打包:mvn clean package
启动项目:java -jar xxx.jar
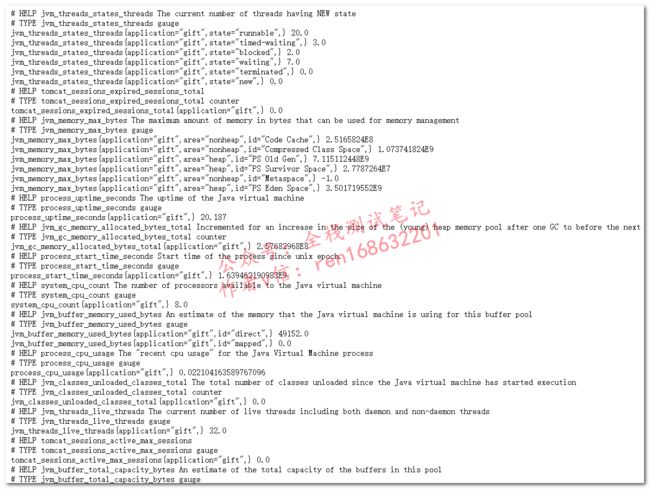
请求:http://xxx:8096/qzcsbj/actuator/prometheus,查看暴露的数据
在Prometheus中添加配置:vim prometheus.yml
  - job_name: "gift"
    metrics_path: "/qzcsbj/actuator/prometheus"
    static_configs:
    - targets: ["qzcsbj:8096"]
重启prometheus:systemctl restart prometheus
访问prometheus:http://ip:9090/targets
targets下可以看到这个端点

grafana导入模板:4701
效果如下:

k8s下java项目监控
打包:mvn clean package -Dmaven.test.skip=true
打镜像:docker build -t 192.168.117.160/gifts/gift:v1 .
把镜像推送到镜像仓库:docker push 192.168.117.160/gifts/gift:v1
编写资源yaml文件:deploy和svc
vim gift.yaml
---
apiVersion: apps/v1
kind: Deployment
metadata:
  name: gift-java-deploy
  namespace: gift
spec:
  replicas: 1
  selector:
    matchLabels:
      k8s-app: gift
  template:
    metadata:
      labels:
        k8s-app: gift
    spec:
      imagePullSecrets:
      - name: gifts-registry

      containers:
      - name: gift
        image: 192.168.117.160/gifts/gift:v1215
        imagePullPolicy: IfNotPresent
        ports:
        - containerPort: 8096

---
apiVersion: v1
kind: Service
metadata:
  name: gift-java-deploy-svc
  namespace: gift
  labels:
    k8s-app: gift-java-deploy-svc
spec:
  type: ClusterIP
  selector:
    k8s-app: gift
  ports:
  - name: gift-java-deploy-svc-api
    port: 8096
    targetPort: 8096
    protocol: TCP
创建资源:kubectl apply -f gift.yaml

查看资源:kubectl get all -n gift

编写servicemonitor资源yaml文件:
vim gift-sm.yaml
---
apiVersion: monitoring.coreos.com/v1
kind: ServiceMonitor
metadata:
  name: java-servicemonitor
  namespace: monitoring
  labels:
    k8s-app: gift
spec:
  endpoints:
  - port: gift-java-deploy-svc-api
    interval: 30s
    scheme: http
    path: '/qzcsbj/actuator/prometheus'
  selector:
    matchLabels:
      k8s-app: gift-java-deploy-svc
  namespaceSelector:
    matchNames:
    - gift
创建资源:kubectl apply -f gift-sm.yaml

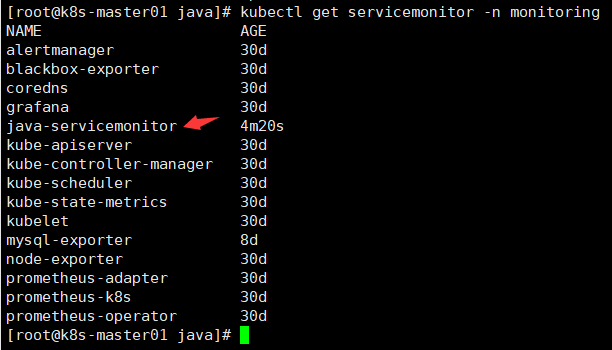
查看资源:kubectl get servicemonitor -n monitoring
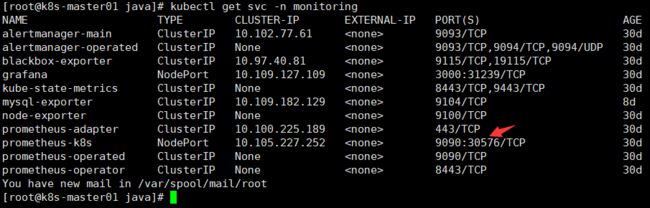
查看prometheus端口:kubectl get svc -n monitoring
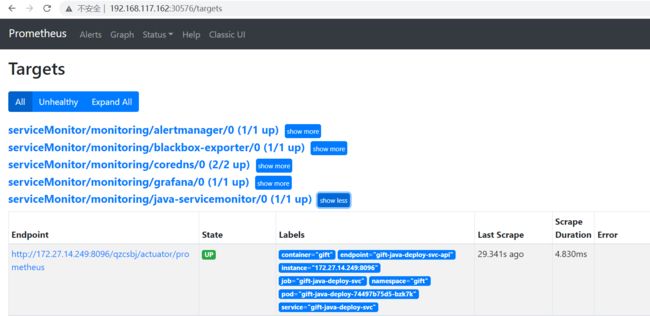
访问prometheus:http://192.168.117.162:30576/
config已经自动生成配置:搜索gift

自动发现

targets
查询数据:jvm_threads_live_threads

grafana导入模板:12856
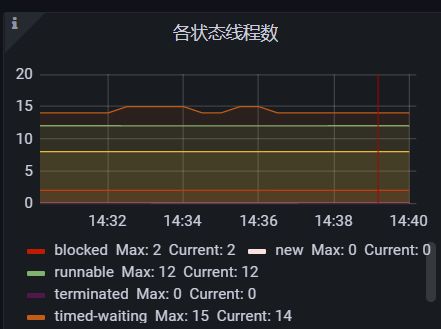
效果:


思考:看到这个监控数据,你的思路是?
【bak】:https://www.cnblogs.com/uncleyong/p/15688404.html
【性能项目实战:jmeter+k8s+微服务+skywalking+efk】汇总
详见:https://www.cnblogs.com/uncleyong/p/15475614.html