sql活动监视器 死锁_使用system_health扩展事件监视SQL Server死锁
sql活动监视器 死锁
Performance monitoring is a must to do the task for a DBA. You should ensure that the database performance is optimal all the time without any impact on the databases. Performance issues act like an open stage, and you need to look at every aspect such as CPU, RAM, server performance, database performance, indexes, blocking, waits, and SQL Server deadlocks. You might face frequent deadlocks issues, and they have a direct impact on the application performance.
性能监视是执行DBA任务所必需的。 您应确保数据库性能始终保持最佳状态,而不会影响数据库。 性能问题就像一个开放阶段,您需要查看各个方面,例如CPU,RAM,服务器性能,数据库性能,索引,阻塞,等待和SQL Server死锁 。 您可能会经常遇到死锁问题,它们直接影响应用程序性能。
You can also go through these articles: SQL Server deadlock definition and Overview and What are SQL Server deadlocks and how to monitor them, to understand deadlock in SQL Server.
您也可以阅读以下文章: SQL Server死锁的定义和概述以及什么是SQL Server死锁以及如何监视死锁,以了解SQL Server中的死锁。
Let’s have a quick overview of “Deadlocks in SQL Server”. Later, we will cover how we can monitor deadlocks using the system_health extended event.
让我们快速了解一下“ SQL Server中的死锁”。 稍后,我们将介绍如何使用system_health扩展事件监视死锁。
SQL Server死锁简介 (Introduction to SQL Server Deadlocks)
SQL Server obtains locks on required resources to perform specific tasks such as Select, Insert, Update, Delete. It is normal behavior and helps to ensure the ACID properties (Atomicity- Consistency – Isolation – Durability).
SQL Server在执行特定任务(例如选择,插入,更新,删除)所需的资源上获得锁。 这是正常行为,有助于确保ACID属性(原子性-一致性-隔离性-耐久性)。
If two processes in SQL Server wants to have exclusive access to a resource held by the other process, it is called a deadlock situation.
如果SQL Server中的两个进程希望对另一个进程拥有的资源具有独占访问权,则称为死锁情况。
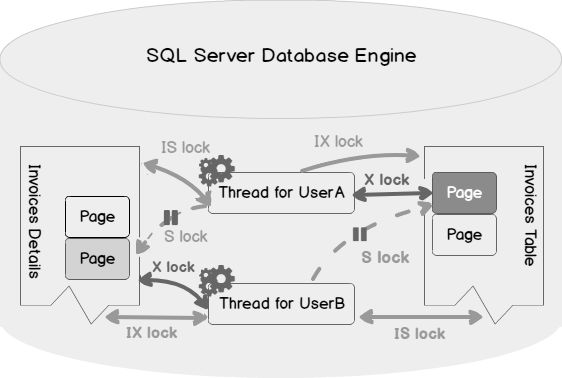
In the following image, we can see that thread A is waiting for the resources held by thread B, and similarly, thread B is waiting for the resources held by thread A. Both the threads cannot process due to insufficient resources.
在下图中,我们可以看到线程A正在等待线程B所拥有的资源,并且类似地,线程B正在等待线程A所拥有的资源。这两个线程由于资源不足而无法处理。
We can further understand the SQL Server deadlock scenario using the following image.
我们可以使用下图进一步了解SQL Server死锁方案。
- User A: Intent Exclusive (IX) lock on the Invoice table and page it requires to modify 用户A:Invoice表和页面上需要修改的Intent Exclusive(IX)锁
- User A also requires an Exclusive lock (X) on the row of the Invoice table 用户A在发票表的行上还需要排他锁(X)
- User B wants to read the same data user A wants to update. It tries to place an Intent Shared lock on the Invoice table and shared lock on the page to read the data. It has to wait until the User A releases the Exclusive lock on the page 用户B要读取用户A要更新的相同数据。 它尝试将Intent Shared锁放在Invoice表上,并将共享锁放在页面上以读取数据。 它必须等到用户A释放页面上的互斥锁
- User A also requires to read data from the Invoice Details page to complete the transaction, but that page has an Exclusive lock by the user B. This thread also needs to wait for the other transactions to complete 用户A还需要从“发票明细”页面中读取数据以完成交易,但用户B对该页面具有排他锁。此线程还需要等待其他交易完成
SQL Server automatically monitors the deadlocks every 5 seconds and kills a session so that another transaction can complete the work. The killed process is known as the Deadlock victim. It is essential to monitor this deadlock situation.
SQL Server每5秒钟自动监视一次死锁并终止会话,以便另一个事务可以完成工作。 被杀死的进程称为死锁受害者。 监视此死锁情况至关重要。
Usually, DBA enables the trace flag 1204 and 1222 to capture the deadlock information in the SQL Server error logs. Out of these two trace flags, the useful and recommended trace flag is 1222 as it returns the resources, their lock and deadlock information in an XML format.
通常,DBA启用跟踪标志1204和1222来捕获SQL Server错误日志中的死锁信息。 在这两个跟踪标志中,有用和推荐的跟踪标志是1222,因为它以XML格式返回资源,其锁定和死锁信息。
Let’s enable these trace flags and simulate a SQL Server deadlock situation.
让我们启用这些跟踪标志并模拟SQL Server死锁情况。
CREATE TABLE TestTable_1
(ID INT IDENTITY(1,1), Name VARCHAR(20))
GO

CREATE TABLE TestTable_2
(ID INT IDENTITY(1,1), Name VARCHAR(20))
GO

INSERT INTO TestTable_1(Name) VALUES ('Rajendra')
Go 100

INSERT INTO TestTable_2(Name) VALUES ('Raj')
Go 100
Let’s open two new query windows in the SSMS and execute the queries in the following order.
让我们在SSMS中打开两个新的查询窗口,并按以下顺序执行查询。
Session 1(Process ID 81) |
Session 2 (Process ID 84) |
|
|
|
|
会话1(进程ID 81) |
会话2(进程ID 84) |
|
|
|
|
SQL Server chooses process Id 84 as the deadlock victim, and you get the following SQL Server deadlock message in the query window.
SQL Server选择进程ID 84作为死锁的受害者,并且您在查询窗口中收到以下SQL Server死锁消息。
Open SQL Server Error Logs in SSMS, and you can see the details of both sessions and the deadlock victim.
在SSMS中打开SQL Server错误日志,您可以看到两个会话和死锁受害者的详细信息。
We can add the trace flag in the startup parameters as well, but it will require restarting SQL Services. We might not want to do this, especially in a very high OLTP environment.
我们也可以在启动参数中添加跟踪标志,但是这将需要重新启动SQL Services。 我们可能不想这样做,尤其是在非常高的OLTP环境中。
Execute the following query to turn off the trace flag 1222.
执行以下查询以关闭跟踪标志1222。
DBCC traceoff(1222,-1)
Let’s look at another way of monitoring the deadlock in SQL Server without enabling the trace flags as well.
让我们看一下在不启用跟踪标志的情况下监视SQL Server中的死锁的另一种方法。
使用system_health扩展事件SQL Server死锁监视 (SQL Server Deadlock monitoring using the system_health extended event)
In the article, Max Worker Threads for SQL Server Always on Availability Group databases, we explored the use of system_health extended event session for the SQL Server Always On Availability Group databases.
在“ SQL Server Always On可用性组”数据库的“ Max Worker Threads ”一文中,我们探讨了对SQL Server Always On可用性组数据库使用system_health扩展事件会话。
You can find the system_health extended event session in SQL Server. It is like a black box recorder that captures useful information and helps to troubleshoot the issues in SQL Server.
您可以在SQL Server中找到system_health扩展事件会话。 它就像一个黑匣子记录器,可以捕获有用的信息并帮助解决SQL Server中的问题。
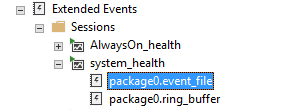
This extended event session has two targets. We will use the ring buffer as well to view the deadlock information. It holds data in memory. Double click on package0_event_file to open the extended event file.
此扩展事件会话有两个目标。 我们还将使用环形缓冲区来查看死锁信息。 它在内存中保存数据。 双击package0_event_file打开扩展的事件文件。
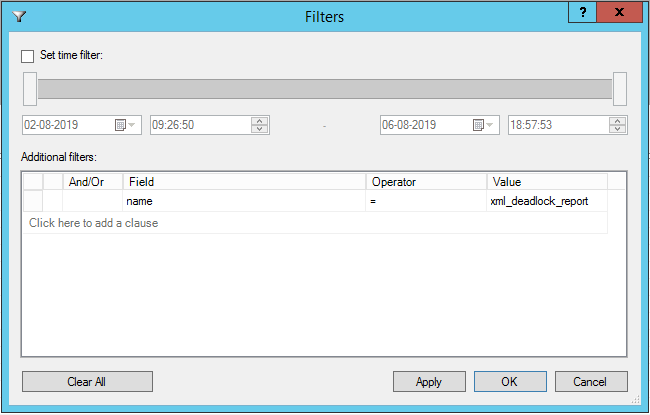
In the event file viewer, right-click and set the filter to display the xml_deadlock_report. You can create additional filters such as date range. We are interested in this particular filter only for this demo.
在事件文件查看器中,右键单击并设置过滤器以显示xml_deadlock_report。 您可以创建其他过滤器,例如日期范围。 我们仅对该演示感兴趣,对此特定过滤器感兴趣。
It shows the deadlocks occurred for the SQL instance.
它显示了SQL实例发生的死锁。
You get both the XML deadlock report and the SQL Server deadlock graph using this extended event.
使用此扩展事件,您将同时获得XML死锁报告和SQL Server死锁图。
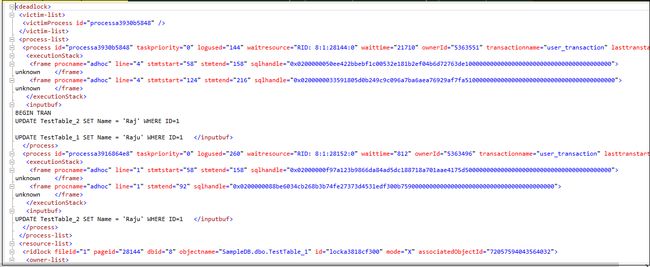
XML Deadlock Report: You can double click on the XML report value, and it opens the complete XML report in the new query window. It gives you complete information about the transactions, locks, deadlock victim and statements
XML死锁报告:您可以双击XML报告值,它会在新的查询窗口中打开完整的XML报告。 它为您提供有关事务,锁,死锁受害者和语句的完整信息
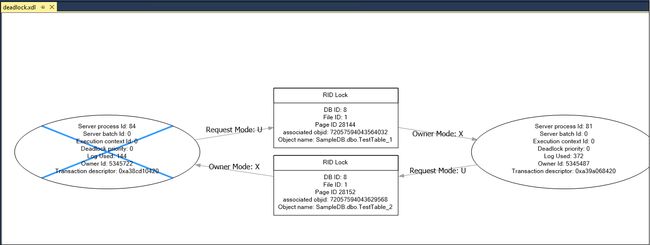
Deadlock Graph: Many times, we want to view the deadlock graph to get the details quickly in a graphical mode. Click on the Deadlock tab, and it shows the following deadlock graph for my demo
死锁图:很多时候,我们希望查看死锁图以图形方式快速获取详细信息。 单击“死锁”选项卡,它为我的演示显示以下死锁图
Deadlock graph is an excellent way to interpret the deadlock related information quickly and effectively.
死锁图是一种快速有效地解释死锁相关信息的极好方法。
These graphs come in handy when it is difficult for DBAs to understand the XML deadlock information.
当DBA难以理解XML死锁信息时,这些图会派上用场。
We learned to get the deadlock information using the system_health extended events in a GUI mode. We can query an extended event file as well to get the deadlock information. We should be familiar with the script as well so that we can quickly retrieve information for the deadlock from the system_health event session.
我们学习了在GUI模式下使用system_health扩展事件获取死锁信息。 我们还可以查询扩展事件文件以获取死锁信息。 我们还应该熟悉该脚本,以便我们可以从system_health事件会话中快速获取有关死锁的信息。
从环形缓冲区目标中使用T-SQL提取SQL Server死锁信息
(Extract SQL Server Deadlock information using T-SQL from the ring buffer target
)
We can use the following query to extract information from the ring buffer target. In this query, you can see that we are querying the system_health extended event and the ring buffer target. In the XML output, we filter the ring buffer data using the event xm_deadlock _report.
我们可以使用以下查询从环形缓冲区目标中提取信息。 在此查询中,您可以看到我们正在查询system_health扩展事件和环形缓冲区目标。 在XML输出中,我们使用事件xm_deadlock _report过滤环形缓冲区数据。
SELECT XEvent.query('(event/data/value/deadlock)[1]') AS DeadlockGraph
FROM (
    SELECT XEvent.query('.') AS XEvent
    FROM (
        SELECT CAST(target_data AS XML) AS TargetData
        FROM sys.dm_xe_session_targets st
        INNER JOIN sys.dm_xe_sessions s
ON s.address = st.event_session_address
        WHERE s.NAME = 'system_health'
            AND st.target_name = 'ring_buffer'
        ) AS Data
CROSS APPLY TargetData.nodes('RingBufferTarget/event[@name="xml_deadlock_report"]') AS XEventData(XEvent)
) AS source;
Let’s execute this in my demo environment and it gives the following deadlock XML. You can click on the hyperlink to see the deadlock XML.
让我们在演示环境中执行此操作,它提供以下死锁XML。 您可以单击超链接以查看死锁XML。
You can click on the SQL Server deadlock XML file and save it as .xdl extension. It converts the XML deadlock into a graphical format.
您可以单击SQL Server死锁XML文件并将其另存为.xdl扩展名。 它将XML死锁转换为图形格式。
Once saved, you can open the .XDL file into the SSMS and view the deadlock graph.
保存后,您可以将.XDL文件打开到SSMS中并查看死锁图。
从环形缓冲区目标中使用T-SQL提取SQL Server死锁信息
(Extract SQL Server Deadlock information using T-SQL from the ring buffer target
)
You can use the query as well to extract information from the extended event file. The benefit of using the extended event file for extracting information is that you get all deadlock information stored in the files. We can also change the size and number of extended event files to capture the more data while the ring buffer has limited data storage and works with the recent data.
您还可以使用查询从扩展事件文件中提取信息。 使用扩展事件文件提取信息的好处是,您可以获得存储在文件中的所有死锁信息。 我们还可以更改扩展事件文件的大小和数量,以捕获更多数据,而环形缓冲区的数据存储空间有限,并且可以处理最新数据。
System_health extended event files are stored in the log folder of the instance. We can easily capture the location of the log folder from the SQL Server error log.
System_health扩展事件文件存储在实例的日志文件夹中。 我们可以轻松地从SQL Server错误日志中捕获日志文件夹的位置。
In the following query, we first use a temporary table to fetch and store the log file information and stored it into a @PATH variable.
在以下查询中,我们首先使用临时表来获取和存储日志文件信息,并将其存储到@PATH变量中。
Later, we use sys.fn_xe_file_target_read_file to read the extended event file. We need to provide the path of the extended event session file. We will pass the variable in this command to retrieve the relevant information.
稍后,我们使用sys.fn_xe_file_target_read_file读取扩展事件文件。 我们需要提供扩展事件会话文件的路径。 我们将在此命令中传递变量以检索相关信息。
sys.fn_xe_file_target_read_file ( path, mdpath, initial_file_name, initial_offset )
sys.fn_xe_file_target_read_file(path,mdpath,initial_file_name,initial_offset)
- Note: I do not recommend to use the GUI method to read the information if the size of the file is large. You might face issues like hung SSMS or time out while retrieving the information
- 注意:如果文件太大,我不建议使用GUI方法读取信息。 检索信息时,您可能会遇到SSMS挂起或超时等问题
CREATE TABLE #errorlog (
            LogDate DATETIME
            , ProcessInfo VARCHAR(100)
            , [Text] VARCHAR(MAX)
            );
DECLARE @tag VARCHAR (MAX) , @path VARCHAR(MAX);
INSERT INTO #errorlog EXEC sp_readerrorlog;
SELECT @tag = text
FROM #errorlog
WHERE [Text] LIKE 'Logging%MSSQL\Log%';
DROP TABLE #errorlog;
SET @path = SUBSTRING(@tag, 38, CHARINDEX('MSSQL\Log', @tag) - 29);
SELECT
  CONVERT(xml, event_data).query('/event/data/value/child::*') AS DeadlockReport,
  CONVERT(xml, event_data).value('(event[@name="xml_deadlock_report"]/@timestamp)[1]', 'datetime')
  AS Execution_Time
FROM sys.fn_xe_file_target_read_file(@path + '\system_health*.xel', NULL, NULL, NULL)
WHERE OBJECT_NAME like 'xml_deadlock_report';
Execute this query, and you get the following deadlock information. You can click on each deadlock report and view the XML information. Save the required XML deadlock report in XSD format, and it gives the graphical execution plan after performing steps similar to mentioned above.
执行此查询,您将获得以下死锁信息。 您可以单击每个死锁报告并查看XML信息。 将所需的XML死锁报告保存为XSD格式,并在执行与上述步骤类似的步骤后给出图形执行计划。
结论 (Conclusion)
This article explained the process to retrieve the SQL Server deadlock information using the default system_health extended event session. You may consider it as a black box recorder to track the SQL instance activities. We do not need to enable trace flags 1204 and 1222 to capture the deadlocks using this extended event session.
本文介绍了使用默认的system_health扩展事件会话检索SQL Server死锁信息的过程。 您可以将其视为跟踪SQL实例活动的黑匣子记录器。 我们不需要启用跟踪标志1204和1222来使用此扩展事件会话捕获死锁。
翻译自: https://www.sqlshack.com/monitoring-sql-server-deadlocks-using-the-system_health-extended-event/
sql活动监视器 死锁

