Echarts 基本使用
常见的数据可视化库:
- D3.js 目前 Web 端评价最高的 Javascript 可视化工具库(入手难)
- ECharts.js 百度出品的一个开源 Javascript 数据可视化库
- Highcharts.js 国外的前端数据可视化库,非商用免费,被许多国外大公司所使用
- AntV 蚂蚁金服全新一代数据可视化解决方案 等等
- Highcharts 和 Echarts 就像是 Office 和 WPS 的关系
ECharts,一个使用 JavaScript 实现的开源可视化库,可以流畅的运行在 PC 和移动设备上,兼容当前绝大部分浏览器(IE8/9/10/11,Chrome,Firefox,Safari等),底层依赖矢量图形库 ZRender,提供直观,交互丰富,可高度个性化定制的数据可视化图表。
介绍
-
是一个JS插件
-
性能好可流畅运行PC与移动设备
-
兼容主流浏览器
-
提供很多常用图表,且可定制。
- 折线图、柱状图、散点图、饼图、K线图
-
官网地址:https://www.echartsjs.com/zh/index.html
下载
https://github.com/apache/incubator-echarts/tree/4.5.0
基本使用
- 引入echarts 插件文件到html页面中
- 准备一个具备大小的DOM容器
<div id="main" style="width: 600px;height:400px;">div>
- 初始化echarts实例对象
var myChart = echarts.init(document.getElementById('main'));
- 指定配置项和数据(option)
可以在官网的实例中找和自己想要的图形相似的实例,把option复制,然后根据需要进行修改
var option = {
    xAxis: {
        type: 'category',
        data: ['Mon', 'Tue', 'Wed', 'Thu', 'Fri', 'Sat', 'Sun']
    },
    yAxis: {
        type: 'value'
    },
    series: [{
        data: [820, 932, 901, 934, 1290, 1330, 1320],
        type: 'line'
    }]
};
- 将配置项设置给echarts实例对象
myChart.setOption(option);
基础配置
需要了解的主要配置:
colortitlelegendtooltipgridxAxisyAxisseries
- color:调色盘颜色列表
- title:标题组件
- legend:图例组件
- tooltip:提示框组件
- toolbox:工具栏
- grid:直角坐标系内绘图网格,单个 grid 内最多可以放置上下两个 X 轴,左右两个 Y 轴
- xAxis:直角坐标系 grid 中的 x 轴
- boundaryGap: 坐标轴两边留白策略 true,这时候刻度只是作为分隔线,标签和数据点都会在两个刻度之间的带(band)中间。
- yAxis:直角坐标系 grid 中的 y 轴
- series:系列列表,每个系列通过
type决定自己的图表类型
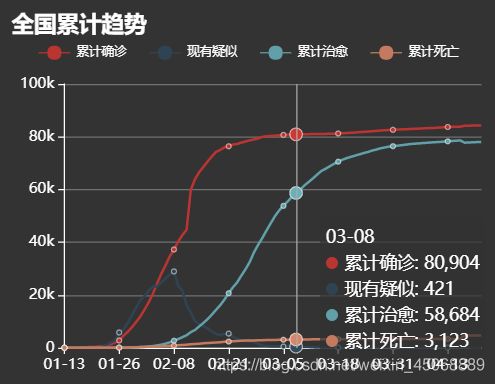
以下的代码和图片不相符,只是为了演示
线条 / 板块颜色
// 注意是个数组
color: ['pink', 'red', 'green', 'skyblue'],
标题
title: {
    text: '全国累计趋势',
    textStyle: {
    	// 标题颜色
        color: '#fff',
    }
},
提示组件
tooltip: {
    // 触发方式
    trigger: 'axis',   // 鼠标放在图形上会出现数据信息
    // 坐标轴指示器,坐标轴触发有效
    axisPointer: {
        // 默认为直线,可选为:'line' | 'shadow'
        // 折线图:line
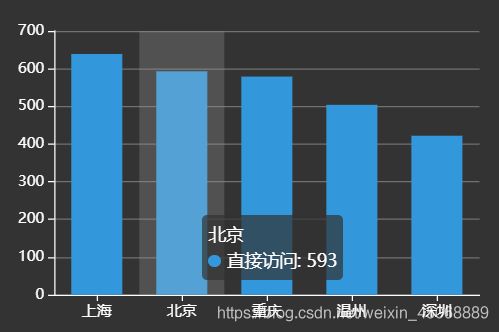
        // 柱形图:shadow 柱形周围会出现阴影
        type: 'shadow'
    }
},


图例组件
// 想要改变文字前面图标的颜色,需要在series中改
legend: {
	// series里面有了 name值则 legend里面的data可以删掉
	top: '8%',   // 还可以设置离left、right、bottom的距离
    textStyle: {
    	color: '#fff',
    	fontSize: 10,
    }
},
网格配置
grid可以控制线形图 柱状图 图表大小
grid: {
	// 距离左边、右边、下面的距离,相当于margin
    left: '3%',
    right: '4%',
    bottom: '3%',
    // 是否显示刻度标签 如果是true 就显示 否则反之
    containLabel: true
},
工具箱组件
内置有导出图片,数据视图,动态类型切换,数据区域缩放,重置五个工具。
不常用,详情到https://echarts.apache.org/zh/option.html#toolbox了解
toolbox: {
},
xAxis
x轴的相关配置
xAxis: {
    type: 'category',
    // 是否让我们的线条和坐标轴有缝隙
    boundaryGap: false,
    // x坐标刻度标签
    data: ['周一', '周二', '周三', '周四', '周五', '周六', '周日'],
    // x 轴文字标签样式
	axisLabel: {
        color: "rgba(255,255,255,1)",
        fontSize: "12"
    },
    // x 轴线条样式
    axisLine: {
	    lineStyle: {
 			color: "rgba(255,255,255,1)",
		}
 	}
},
yAxis
设置y轴的相关配置
yAxis: {
    type: 'value',
     // y 轴文字标签样式
    axisLabel: {
        color: "rgba(255,255,255,1)",
        fontSize: "12"
    },
    // y轴线条样式
    axisLine: {
        lineStyle: {
            color: "rgba(255,255,255,1)",
        }
    },
    // y 轴分隔线样式
    splitLine: {
        lineStyle: {
            color: "rgba(255,255,255,.3)"
        }
    }
},
series 系列图表配置
type决定着显示那种类型的图表
折线图 line
series: [
	// 这一个大括号为一个系列,也就是一条折线
    {
        name: '累计确诊',
        // 折线图
        type: 'line',
        symbol: "circle",  // 默认拐点是空心圆(中间是白色的),改成实心圆
        itemStyle: {
	        normal: {
	            color: "#ba3431",  // 会设置点和线的颜色
	            borderColor: '#fff',
	            borderWidth: '.5'
	       }
        },
        data: [120, 132, 101, 134, 90, 230, 210]
    },
	......
]
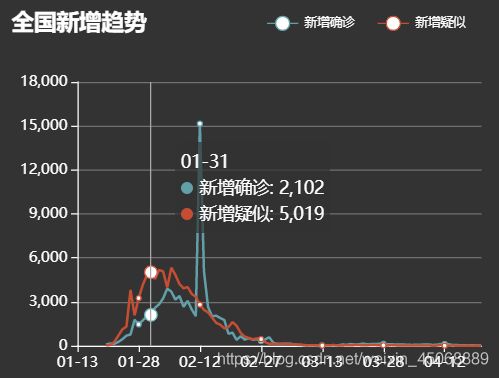
没有配置symbol: "circle"时,默认图例和拐点中心都是白色的

配置symbol: "circle"和itemStyle后,可以根据自己的需求调整样式

柱形图
series: [
    {
      name: '直接访问',
      type: 'bar',
      barWidth: '60%',  // 柱形宽度
      data: [120, 132, 101, 134, 90, 230, 210]
    }
  ]