mAP—目标检测模型的评估指标
mAP
最近在做目标检测相关的项目,对于mAP一直没有搞懂,因此花了一天来学习,并将其整理在这篇博客里以供参考学习。
首先mAP,即平均精度均值(mean Average Precision),是目标检测中最为常用的评估指标。例如对于R-CNN和YOLO性能的评价都会用到mAP。
mAP将ground truth 和检测到的bounding box进行比较,并返回一个值,这个值越高说明模型的检测越准确。
Ground Truth
对于任何检测算法,都需要知道 ground truth (真实标签)的数据。在目标检测算法中,ground truth中包含两部分:
- 物体类别
- 图像中每个物体的真实边界框
具体的,见下表
| class | x_center | y_center | w | h |
|---|---|---|---|---|
| 2 | 0.7185185058042407 | 0.27656675362959504 | 0.08148148003965616 | 0.1226158021017909 |
| 1 | 0.8462962813209742 | 0.13896457571536303 | 0.07407407276332378 | 0.09809264168143272 |
| 1 | 0.7999999858438969 | 0.29155312944203615 | 0.04444444365799427 | 0.08719345927238464 |
表格中是真实的 ground truth 的数据,其中边界框的坐标是经过归一化处理之后的。
mAP的含义以及计算
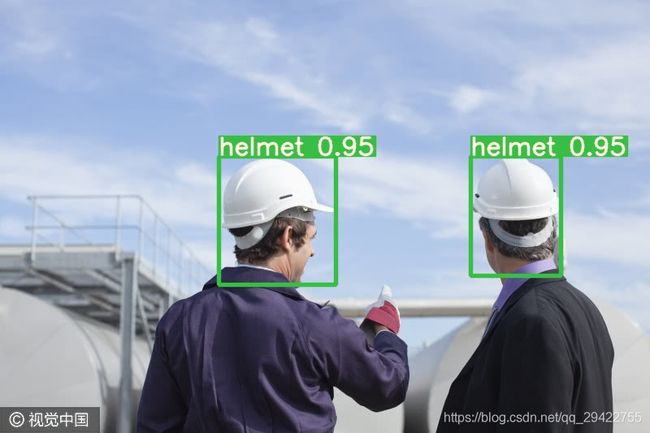
mAP将ground truth与检测到的bounding box进行比较,并返回一个置信度(confidence score)。置信度越高模型的检测越准确。因此在检测的过程中只考虑某些高于阈值的置信度。

上图是对图像中的头盔进行检测,可以看出对于检测出的头盔,都有着较高的置信度。
Precision 和 Recall
在正式介绍mAP之前,要首先介绍两个评价标准,即Precision(精度)和 Recall(召回率)。对于一个类别来说,模型在测试的时候会出现以下情况:TP(真正例),FN(假负例),FP(假正例),TN(真负例)。在检测过程中,对于图中每个目标都会返回一个置信度,当置信度大于设置的阈值时,该目标即为TP,否则为FP。而FN则代表未检测到的目标数量。TN在目标检测中不予考虑。
因此可以算出各个类别的: p r e c i s i o n = T P T P + F P precision = \frac{TP}{TP + FP} precision=TP+FPTP 和 r e c a l l = T P T P + F N recall = \frac{TP}{TP+FN} recall=TP+FNTP 其中 r e c a l l recall recall的分母即为ground truth的总数。
画出Precision-Recall曲线
从上述对于Precision和Recall的定义可以看出:
- Precision的值越高,模型将一个样本分为正例的置信度就越高。
- Recall的值越高,模型将正样本分为正例的数量就越多,即真正例(TP)的数量就越多。
此外,当模型中有高Recall但低Precision时,模型正确分类了许多样本,但同时也有许多负类样本被预测为正类。当模型的Precision较高但Recall较低时,模型将正类样本分类为正例的准确率是很高的,但是此时漏检的样本较多(即假负例 FN 较多)
鉴于精度和召回率的重要性,可以通过精度-召回率曲线来显示不同阈值的精度和召回率值之间的权衡。该曲线有助于选择最佳阈值以最大化两个指标。
若要画出precision-recall曲线,需要:
- ground-truth标签
- 样本预测的置信度
- 将样本置信度转化为标签的阈值
代码如下:
import numpy as np
import matplotlib.pyplot as plt
# 真实类别 ground truth 标签
y_true = ["positive", "negative", "negative", "positive", "positive", "positive", "negative", "positive", "negative", "positive", "positive", "positive", "positive", "negative", "negative", "negative"]
# 预测分数
pred_scores = [0.7, 0.3, 0.5, 0.6, 0.55, 0.9, 0.4, 0.2, 0.4, 0.3, 0.7, 0.5, 0.8, 0.2, 0.3, 0.35]
# 设置阈值
thresholds = np.arange(start=0.2, stop=0.7, step=0.05)

def precision_recall_curve(y_true, pred_scores, thresholds):
    precisions = []
    recalls = []

    for threshold in thresholds:
    	# 通过阈值将预测得分转化为标签
        y_pred = ["positive" if score >= threshold else "negative" for score in pred_scores]

        precision = precision_score(y_true=y_true, y_pred=y_pred, pos_label="positive")
        recall = recall_score(y_true=y_true, y_pred=y_pred, pos_label="positive")

        precisions.append(precision)
        recalls.append(recall)

    return precisions, recalls
precisions, recalls = precision_recall_curve(y_true=y_true, pred_scores=pred_scores, thresholds=thresholds)
# 画出precision-recall曲线
plt.plot(recalls, precisions, linewidth=4, color="red")
plt.xlabel("Recall", fontsize=12, fontweight='bold')
plt.ylabel("Precision", fontsize=12, fontweight='bold')
plt.title("Precision-Recall Curve", fontsize=15, fontweight="bold")
plt.show()
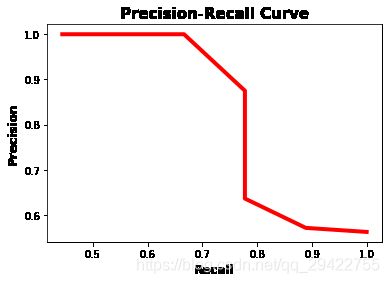
如图为画出的曲线。

在Precision-Recall曲线中,当Recall值增加时Precision的值随之降低。这是因为当样本中正类样本的数量增加时,Recall的值随之增加,但是正确分类每个正样本的准确性会降低,即Precision降低。
可以使用F1值来衡量Precision和Recall之间的平衡。 F 1 = 2 × p r e c i s i o n × r e c a l l p r e c i s i o n + r e c a l l F1 = 2 \times \frac{precision \times recall}{precision + recall} F1=2×precision+recallprecision×recall当F1值较高时,这意味着Precision和Recall的值都比较高,当F1的值较低时,意味着Precision和Recall之间越不平衡。
f1 = 2 * (np.array(precisions) * np.array(recalls)) / (np.array(precisions) + np.array(recalls))
print(list(f1))
"""
f1 = [0.72,
	 0.6956521739130435,
	 0.6956521739130435,
	 0.7000000000000001,
	 0.7368421052631577,
	 0.823529411764706,
	 0.823529411764706,
	 0.8,
	 0.7142857142857143,
	 0.6153846153846153]
"""
由F1的值可知,F1的最大值为0.8235,即list 的 index为5。而召回和精确列表中的第六个元素分别为0.778和0.875。对应的阈值为0.45。下图用蓝色显示了对应于召回率和精确度之间最佳平衡的点的位置。总之,平衡precision和recall的最佳阈值为0.45,此时precision为0.875,recall为0.778。
plt.plot(recalls, precisions, linewidth=4, color="red", zorder=0)
plt.scatter(recalls[5], precisions[5], zorder=1, linewidth=6)
plt.xlabel("Recall", fontsize=12, fontweight='bold')
plt.ylabel("Precision", fontsize=12, fontweight='bold')
plt.title("Precision-Recall Curve", fontsize=15, fontweight="bold")
plt.show()
AP(Average Precision)
AP是将Precision-Recall曲线汇总为单个值的方法。该值代表了所有precision的平均值: A P = ∑ k = 0 n − 1 ( r e c a l l k − r e c a l l k + 1 ) × p r e c i s i o n k AP = \sum\limits_{k=0}^{n-1}{(recall_{k}-recall_{k+1})\times {precision_{k}}} AP=k=0∑n−1(recallk−recallk+1)×precisionk r e c a l l n = 0 , p r e c i s i o n n = 1 recall_{n} = 0, \quad precision_{n} = 1 recalln=0,precisionn=1 其中 n n n 是阈值的个数。
在计算AP时,要遍历所有的precision/recall,计算当前recall和下一次recall的差值,然后乘以当前的精度。即在上式中,AP是每个阈值精度的加权和,且权重是recall的增量。
用python计算AP
recalls = np.array(recalls)
precisions = np.array(precisions)
AP = np.sum((recalls[:-1] - recalls[1:]) * precisions[:-1])
print(AP)

"""
AP = 0.8898809523809523
"""
IoU
训练一个目标检测模型的时候,通常需要两个输入:
- 一张图像
- 图像中每个对象的ground truth
该模型预测检测到的对象的边界框。而预测框往往不会与ground truth完全匹配。下图是一张猫的图片。物体的ground truth是绿色的,而预测的是红色的。只从图中来看,模型是否做出了匹配度高的好预测?

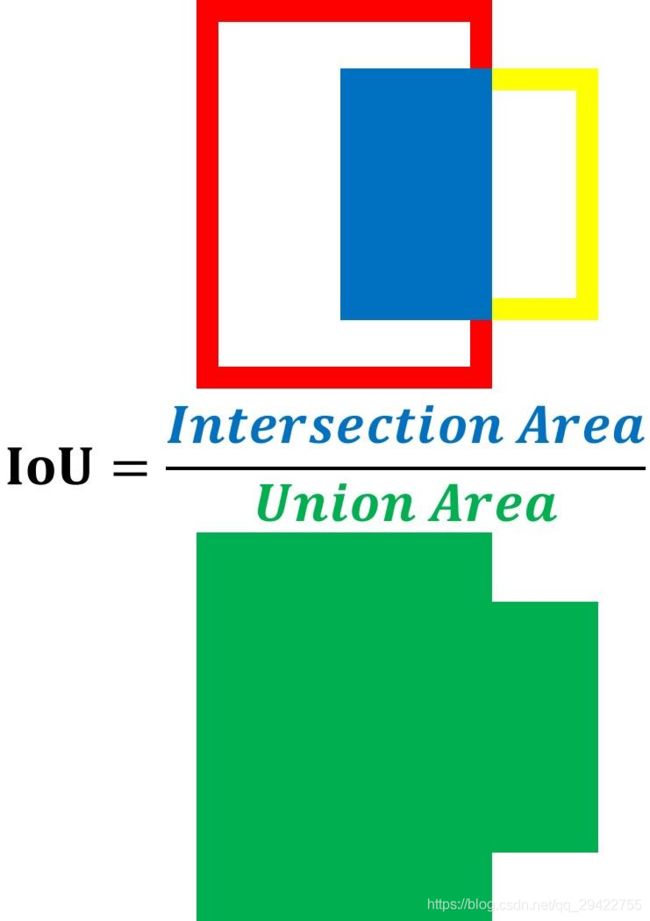
很显然,对于模型作出的预测有多好这个问题,仅凭肉眼是无法作出量化的。因此引入了IoU(Intersection over Union)。IoU是预测框和ground truth交集合并集的比值,也被成为Jaccard指数。 IoU有助于了解模型所预测的框中是否包含要检测的目标。IoU是根据下图中的等式所计算,用两个方框的交集面积除以它们的并集面积。IoU越高,预测越好。

可以通过如下代码来计算IoU
import cv2 as cv
def iou(boxA, boxB):
	"""
    计算IoU
    :param boxA: 真实框,ground truth
    :param boxB: 预测框
    :return: iou
    """
    xA = max(boxA[0], boxB[0])
    yA = max(boxA[1], boxB[1])
    xB = min(boxA[2], boxB[2])
    yB = min(boxA[3], boxB[3])

    interArea = max(0, xB-xA+1) * max(0, yB-yA+1)

    boxAArea = (boxA[2] - boxA[0] + 1) * (boxA[3] - boxA[1] + 1)
    boxBArea = (boxB[2] - boxB[0] + 1) * (boxB[3] - boxB[1] + 1)

    union = float(boxAArea + boxBArea - interArea)
    iou = interArea / union

    return iou

if __name__ == 'main':
	path = "C:/Users/wyz93/Pictures/cat2.jpg"
	image = cv.imread(path)
	gt_box = [210, 130, 700, 760]
	pred_box = [220, 150, 660, 750]

	cv.rectangle(image, tuple(gt_box[:2]),
	              tuple(gt_box[2:]), (0, 255, 0), 2)
	cv.rectangle(image, tuple(pred_box[:2]),
	              tuple(pred_box[2:]), (0, 0, 255), 2)
	cv.putText(image, "IoU: {:.4f}".format(iou), (10, 30),
	               cv.FONT_HERSHEY_SIMPLEX, 0.6, (0, 255, 0), 2)
	iou = iou(gt_box, pred_box)
	cv.imshow("cat", image)
	cv.imwrite("cat_res.jpg", image)
	cv.waitKey(0)
	cv.destroyAllWindows()
结果如下图所示:
为了客观地判断模型是否正确地预测了盒子的位置,使用了阈值。如果模型预测一个框的IoU得分大于或等于阈值,那么在预测的框和一个基本事实框之间有很高的重叠。这意味着该模型能够成功地检测到一个对象。检测到的区域被分类为 Positive (即包含对象)。另一方面,当IoU分数小于阈值时,模型作出了错误的预测,因为预测框与基本事实框不重叠。这意味着检测到的区域被分类为 Negative (即不包含对象). c l a s s ( I o U ) = { p o s i t i v e I o U ≥ T h r e s h o l d n e g a t i v e I o U ≥ T h r e s h o l d class(IoU)=\begin {cases} positive& \text{ }IoU\ge Threshold \\ negative& \text{ }IoU\ge Threshold \end {cases} class(IoU)={positivenegative IoU≥Threshold IoU≥Threshold

由图可知,计算的到的IoU值为0.8555,这意味着预测框和真实框有着85.6%的重叠,因此该预测是较为准确的。
Mean Average Precision (mAP)
通常,对象检测模型用不同的IoU阈值进行评估,其中每个阈值可能给出不同于其他阈值的预测。假设模型由分布在2个类中的10个对象组成的图像提供。那么,如何计算mAP?
要计算mAP,首先计算每个类别的AP。对所有类别的AP求均值即可得到mAP。
m A P = 1 n ∑ k = 1 n A P k mAP = \frac{1}{n} \sum_{k=1}^{n}{AP_{k}} mAP=n1k=1∑nAPk其中k代表类别,n代表类别总数。
扩展
在yolov5中使用了GIoU作为回归损失,那为什么用GIoU呢?
首先,IoU有如下两个不足:
- 如果两个目标没有重叠,IoU将会为0,并且不会反应两个目标之间的距离,在这种无重叠目标的情况下,如果IoU用作于损失函数,梯度为0,无法优化。
- IoU无法区分两个对象之间不同的对齐方式。更确切地讲,不同方向上有相同交叉级别的两个重叠对象的IoU会完全相等。
鉴于此,人们便提出了GIoU来代替IoU
对GIoU(Generalized Intersection over Union),当两个框重叠时相较于IoU可更好的反应重叠程度,当两框不重叠时,GIoU可以更好的进行优化使得预测框不断接近ground truth最终得到一个好的预测结果。
对于任意的两个A、B框,首先找到一个能够包住它们的最小方框C。然后计算C \ (A ∪ B) 的面积与C的面积的比值。GIoU计算公式如下: G I o U = I o U − ∣ C \ ( A U B ) ∣ ∣ C ∣ GIoU = IoU-\frac{|C\backslash (AUB)|}{|C|} GIoU=IoU−∣C∣∣C\(AUB)∣其中C \ (A ∪ B) 的面积为C的面积减去A∪B的面积。再用A、B的 I o U IoU IoU值减去这个比值得到 G I o U GIoU GIoU。
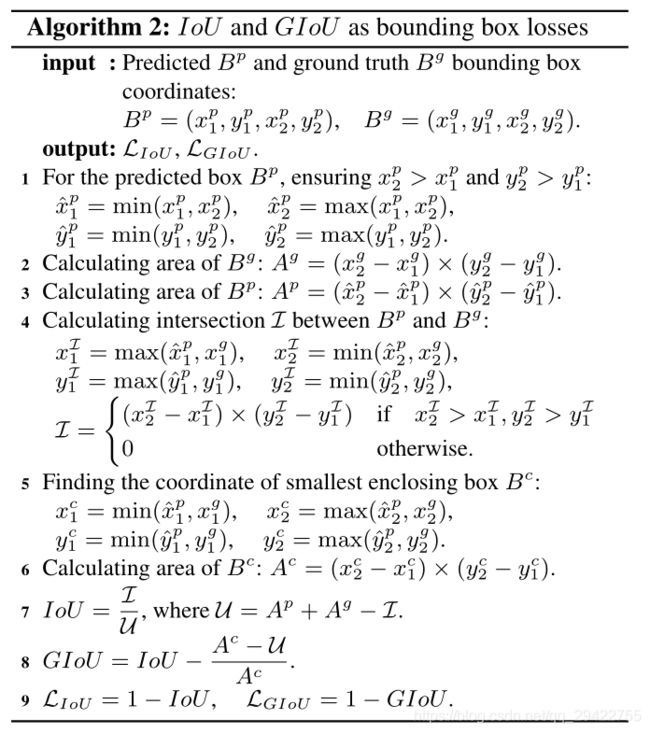
计算GIoU Loss的伪代码如下:

在这里我只计算GIoU的值,因此基于伪代码上述IoU的计算函数,计算预测框和真实框的代码如下:
在这里插入代码片
def iou(boxA, boxB):
    """
    计算IoU
    :param boxA: 真实框,ground truth
    :param boxB: 预测框
    :return: iou
    """
    xA = max(boxA[0], boxB[0])
    yA = max(boxA[1], boxB[1])
    xB = min(boxA[2], boxB[2])
    yB = min(boxA[3], boxB[3])

    interArea = max(0, xB-xA+1) * max(0, yB-yA+1)

    boxAArea = (boxA[2] - boxA[0] + 1) * (boxA[3] - boxA[1] + 1)
    boxBArea = (boxB[2] - boxB[0] + 1) * (boxB[3] - boxB[1] + 1)

    union = float(boxAArea + boxBArea - interArea)
    iou = interArea / union
    return iou, union


def giou(boxP, boxG):
   """
    计算GIoU
    :param boxP: 预测框
    :param boxG: 真实框,ground truth
    :return: giou iou
    """
    iou, union = iou(boxP, boxG)
    x1_c = min(boxP[0], boxG[0])
    y1_c = min(boxP[1], boxG[1])
    x2_c = max(boxP[2], boxG[2])
    y2_c = max(boxP[3], boxG[3])
    AreaC = (x2_c - x1_c) * (y2_c - y1_c)
    gioU = iou - (AreaC - union) / AreaC
    return giou, iou


if __name__ == "main":
	image = cv.imread(path)
    gt_box = [210, 130, 700, 760]
    pred_box = [220, 150, 660, 750]

    cv.rectangle(image, tuple(gt_box[:2]),
                  tuple(gt_box[2:]), (0, 255, 0), 2)
    cv.rectangle(image, tuple(pred_box[:2]),
                  tuple(pred_box[2:]), (0, 0, 255), 2)

    giou, iou = giou(gt_box, pred_box)

    cv.putText(image, "IoU: {:.4f}".format(iou), (10, 30),
               cv.FONT_HERSHEY_SIMPLEX, 0.6, (0, 255, 0), 2)
    cv.putText(image, "GIoU: {:.4f}".format(giou), (10, 60),
               cv.FONT_HERSHEY_SIMPLEX, 0.6, (0, 255, 0), 2)
    cv.imshow("cat", image)
    cv.imwrite("cat_det.jpg", image)
    cv.waitKey(0)
    cv.destroyAllWindows()
GIoU和IoU计算结果如下:

若要获得这只猫的无水印原图,点击这里
参考
目标检测模型的评估指标mAP详解
Evaluating Object Detection Models Using Mean Average Precision (mAP)
paper:
Generalized Intersection over Union: A Metric and A Loss for Bounding Box
Regression
