基于Python实现的聚类算法【K-means&系统聚类&DBSCAN】
1.1K-means聚类算法过程
- 1.从n个样本数据中随机选取K个对象作为初始的聚类中心
- 2.分别计算每个样本到各个聚类中心的距离,讲对象分配到距离最近的聚类中
- 所有对象分配完毕,重新计算K个聚类的中心
- 与前一次计算的K个聚类中心做比较,如果聚类中心发生变化,转到2,否则转到5
- 当质心不发生变化时,停止并输出结果
1.2代码实现
# 1.导入数据 Import dataset
from  sklearn import datasets

iris = datasets.load_iris()

# 2.模型训练 Model training
from sklearn import cluster

X = iris.data
k_means = cluster.KMeans(n_clusters=3)
"""
n_clusters:Geometric clustering center
max_iter:Maximum number of iterations
n_init:Select the number of clusters with different clustering centers
cluster_centers_:Cluster center coordinates
labels_:Classification result for each point
inertia_:Sum of distances from samples to cluster centers
"""
k_means.fit(X)
print('Targets of iris dataset:\n%s'%iris.target)
print('Predicted labels:\n%s'%k_means.labels_)

# 3.模型可视化展示 Model visualization
import matplotlib.pyplot as plt
target_names = iris.target_names
y = iris.target
colors = ['#4EACC5','#FF9C34','#4E9A06']
lw = 2
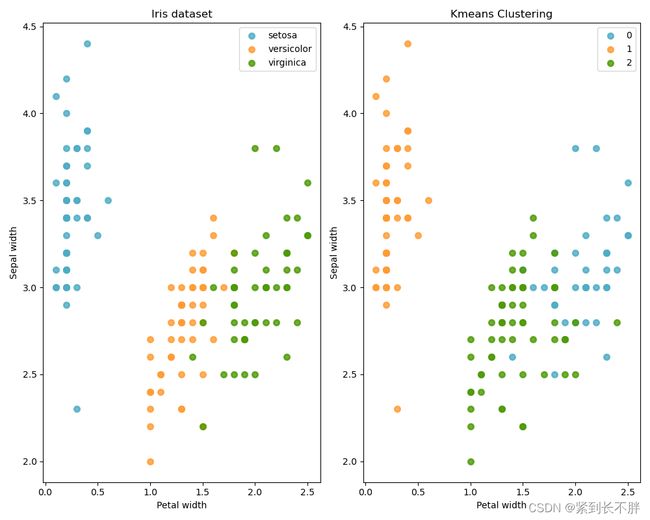
fig = plt.figure(figsize=(10,8))
ax1 = fig.add_subplot(121)
ax2 = fig.add_subplot(122)
for color ,i , target_name in zip(colors,[0,1,2],target_names):
    ax1.scatter(X[y==i,3],X[y==i,1],color=color,alpha = 0.8,lw=lw,label=target_name)
    ax2.scatter(X[k_means.labels_==i,3],X[k_means.labels_==i,1],color=color,alpha = 0.8,lw=lw,label=i)

ax1.set_title('Iris dataset')
ax1.set_xlabel('Petal width')
ax1.set_ylabel('Sepal width')
ax1.legend(loc = 'best',scatterpoints = 1)


ax2.set_title('Kmeans Clustering')
ax2.set_xlabel('Petal width')
ax2.set_ylabel('Sepal width')
ax2.legend(loc = 'best',scatterpoints = 1)
plt.show()

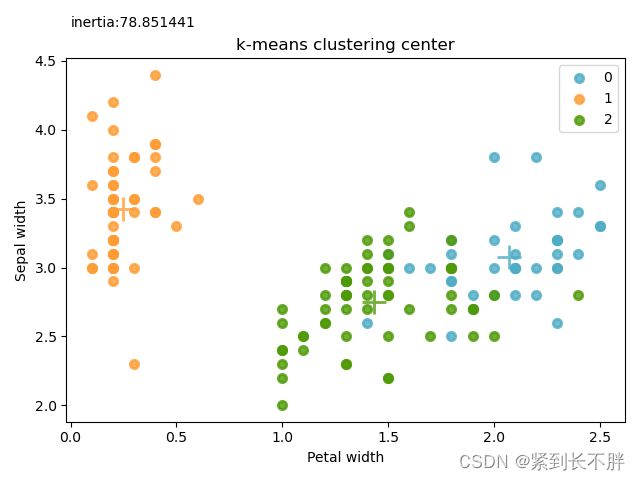
# 3.1 绘制聚类中心
from mpl_toolkits.mplot3d import Axes3D
fig = plt.figure()
for color ,i , target_name in zip(colors,[0,1,2],target_names):
    plt.scatter(X[k_means.labels_==i,3],X[k_means.labels_==i,1],color=color,alpha = 0.8,lw=lw,label=i)
    plt.scatter(k_means.cluster_centers_[i,3], k_means.cluster_centers_[i,1], color=color, alpha=0.8, s=300,lw=lw, marker='+')

plt.title('k-means clustering center')
plt.xlabel('Petal width')
plt.ylabel('Sepal width')
plt.legend(loc = 'best',scatterpoints = 1)
plt.text(0,4.75,'inertia:%f'%k_means.inertia_)
plt.show()

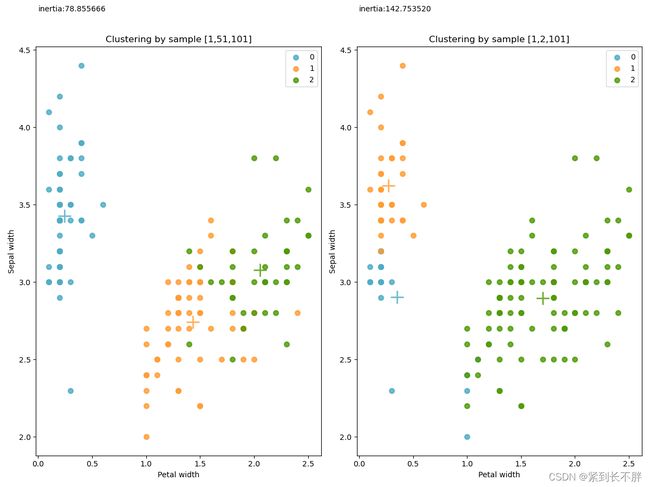
# 3.2 评估初始指定的集合中心对于聚类结果的影响
import random
import numpy as np
k_1 = cluster.KMeans(n_clusters=3,n_init=1,init=X[[1,51,101],:])
k_1.fit(X)

k_2 = cluster.KMeans(n_clusters=3,n_init=1,init=X[[1,2,101],:])
k_2.fit(X)

fig = plt.figure(figsize=(12,9))
ax1 = fig.add_subplot(121)
ax2 = fig.add_subplot(122)
for color ,i , target_name in zip(colors,[0,1,2],target_names):
    ax1.scatter(X[k_1.labels_==i,3],X[k_1.labels_==i,1],color=color,alpha = 0.8,lw=lw,label=i)
    ax1.scatter(k_1.cluster_centers_[i, 3], k_1.cluster_centers_[i, 1], color=color, alpha=0.8, s=300, lw=lw,
                marker='+')

    ax2.scatter(X[k_2.labels_==i,3],X[k_2.labels_==i,1],color=color,alpha = 0.8,lw=lw,label=i)
    ax2.scatter(k_2.cluster_centers_[i, 3], k_2.cluster_centers_[i, 1], color=color, alpha=0.8, s=300, lw=lw,
                marker='+')


ax1.set_title('Clustering by sample [1,51,101]')
ax1.set_xlabel('Petal width')
ax1.set_ylabel('Sepal width')
ax1.legend(loc = 'best',scatterpoints = 1)


ax2.set_title('Clustering by sample [1,2,101]')
ax2.set_xlabel('Petal width')
ax2.set_ylabel('Sepal width')
ax2.legend(loc = 'best',scatterpoints = 1)
ax1.text(0,4.75,'inertia:%f'%k_1.inertia_)
ax2.text(0,4.75,'inertia:%f'%k_2.inertia_)

plt.show()
1.3 输出结果
Targets of iris dataset:
[0 0 0 0 0 0 0 0 0 0 0 0 0 0 0 0 0 0 0 0 0 0 0 0 0 0 0 0 0 0 0 0 0 0 0 0 0
 0 0 0 0 0 0 0 0 0 0 0 0 0 1 1 1 1 1 1 1 1 1 1 1 1 1 1 1 1 1 1 1 1 1 1 1 1
 1 1 1 1 1 1 1 1 1 1 1 1 1 1 1 1 1 1 1 1 1 1 1 1 1 1 2 2 2 2 2 2 2 2 2 2 2
 2 2 2 2 2 2 2 2 2 2 2 2 2 2 2 2 2 2 2 2 2 2 2 2 2 2 2 2 2 2 2 2 2 2 2 2 2
 2 2]
Predicted labels:
[1 1 1 1 1 1 1 1 1 1 1 1 1 1 1 1 1 1 1 1 1 1 1 1 1 1 1 1 1 1 1 1 1 1 1 1 1
 1 1 1 1 1 1 1 1 1 1 1 1 1 2 2 0 2 2 2 2 2 2 2 2 2 2 2 2 2 2 2 2 2 2 2 2 2
 2 2 2 0 2 2 2 2 2 2 2 2 2 2 2 2 2 2 2 2 2 2 2 2 2 2 0 2 0 0 0 0 2 0 0 0 0
 0 0 2 2 0 0 0 0 2 0 2 0 2 0 0 2 2 0 0 0 0 0 2 0 0 0 0 2 0 0 0 2 0 0 0 2 0
 0 2]
| center-dividing line |
|---|
2.1 系统聚类算法过程
- 将每一个对象归为1类,共得到N类,每类仅包含一个对象类与类之间的距离就是它所包含的对象之间的距离。
- 找到最近的两个类并合并成一个类,于是总的类少一个
- 重新计算新的类与旧类之间的距离
- 重复2,3步骤,直到最后一个合并成一个类为止。此类包含了N个对象。
其中AgglomerativeClustering里面的参数为
n_clusters:聚类的个数
linkage:指定层次聚类相似度的判断方法,包括ward、average、complete
ward:组间距离等于两组对象之间的最小距离
average:组间距离等于两组对象之间的平均距离
complete:组间距离等于两组对象的最大距离
2.2 代码实现
from sklearn.datasets._samples_generator import make_blobs
from sklearn.cluster import AgglomerativeClustering
import numpy as np
import matplotlib.pyplot as plt
from itertools import cycle

# 1.产生实验数据
centers = [[1,1],[-1,-11],[1,-1]] # 定义随机数据中心
n_samples = 3000 # 定义样本个数
X,lables_true = make_blobs(n_samples=n_samples,centers=centers,cluster_std=2,random_state=121) # 产生数据

# 2.训练模型
linkages =  ['ward','average','complete'] # 相似度的判断方法
n_clusters_ = 3 # 聚类个数
ac = AgglomerativeClustering(linkage=linkages[2],n_clusters=n_clusters_)
ac.fit(X) # 训练模型

labels = ac.labels_ # 每个数据分类

# 3.绘图展示
plt.figure(1)
plt.clf() # 清除内存

colors = cycle('bgrcmykbgrcmykbgrcmykbgrcmyk')

for k,col in zip(range(n_clusters_),colors):
    # 根据lables中的值是否等于k,重组一个True,Flase数组
    my_members = labels == k
    # X[my_members,0],取出my_members对应位置为True的值的横坐标
    plt.plot(X[my_members,0],X[my_members,1],col+'.')

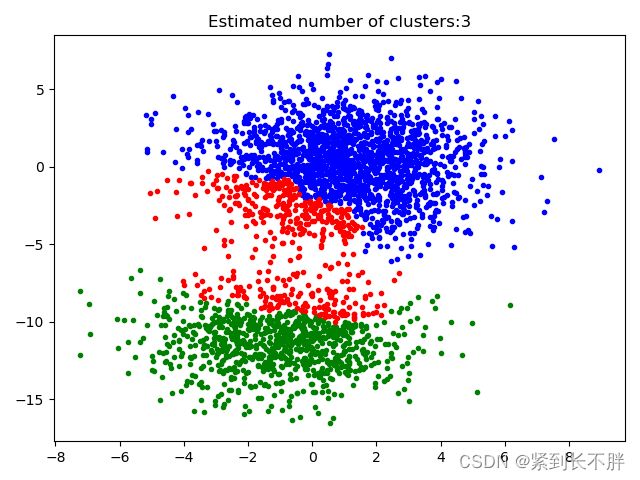
plt.title('Estimated number of clusters:%d'%n_clusters_)
plt.show()
2.3 输出结果
| center-dividing line |
|---|
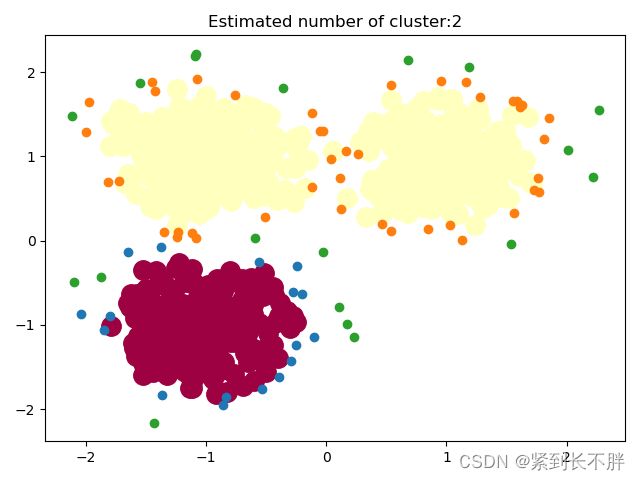
3.1 DBSCAN聚类算法过程
DBSCAN聚类算法需要两个参数,扫描半径(eps)和最小包含数(min_samples)
- 第一步:遍历所有点,寻找核心点
- 第二步:联通核心点,并扩展某一个分类集合中点的个数
3.2 代码实现
from sklearn.datasets._samples_generator import make_blobs
from sklearn.cluster import DBSCAN
import numpy as np
import matplotlib.pyplot as plt
from itertools import cycle
from sklearn.preprocessing import StandardScaler

# 1.产生随机数据中心
centers = [[1,1],[-1,1],[-1,-1]]
n_samples = 750
# 产生数据,此实验结果收到cluster_std的影响, 或者说受eps和cluster_std的差值影响
X,labels_true = make_blobs(n_samples = n_samples,centers=centers,cluster_std=0.4,random_state=12)

# 2.设置分层聚类函数
db = DBSCAN(eps=0.3,min_samples=10)
# 3.训练数据
db.fit(X)
# 4.初始化一个全是False的bool类型数据
core_samples_mask = np.zeros_like(db.labels_,dtype=bool)
"""
这里是一个关键点,代码xy = X[class_memer_mask&~core_samples_mask]:db.core_sample_indices_表示的是某个
点在寻找核心点集合的过程中,暂时被标记为噪声点(即周围点小于min_samples),它并不是最终的噪声点,在对核心点进行联通的过程中,这部分
点会被及进行重新归类(即标签并不会使表示噪声点的-1),也可以这样理解,这些点不适合做核心点,但是会被包含在某一个核心点的范围之类。
"""

core_samples_mask[db.core_sample_indices_] = True
# 5.每个数据的分类
labels = db.labels_
# 6.分类个数:labels中包含-1,表示噪声点
n_cluster_ = len(np.unique(labels))-(1 if -1 in labels else 0)
# 7.绘图
unique_labels = set(labels)
# np.linspace返回[0,1]之间的len(unique_labels) 个数
# plt.cm 一个带颜色的映射模块

# 生成每一个colors包含4个值,分别是r、g、b、a
# 其实这行代码的意思就是生成4个可以和光谱对应的颜色值
colors = plt.cm.Spectral(np.linspace(0,1,len(unique_labels)))
plt.figure(1)
plt.clf()

for k ,col in zip(unique_labels,colors):
    # -1表示噪声点们这里是k表示黑色
    if k == -1:
        col = 'k'
    # 生成一个True、False数组,将labels == k设置成True
    class_member_mask = (labels == k)
    # 两个数组做与运算,找出既是核心点又是等于分类k的值,即markeredgecolor='k'
    xy = X[class_member_mask & core_samples_mask]
    plt.plot(xy[:,0],xy[:,1],'o',c=col,markersize=14)
    # ~优先级提高,按位对core_samples_mask,求反,求出的是噪音点的位置。

    #&运算之后,求出虽然刚开始是噪声点的位置,但是重新归类后却属于k的点
    # 对核心分类之后进行拓展
    xy = X[class_member_mask & ~core_samples_mask]
    plt.plot(xy[:,0],xy[:,1],'o',markersize=6)
plt.title('Estimated number of cluster:%d'%n_cluster_)
plt.show()
