解决热力图(heatmap)坐标处边界无法完整显示的问题
本篇文章记录如何快速安装matplotlib库,解决sns.heatmap()方法绘制的热力图最上面一行和最小面一行只显示一半,数字不居中的问题。
小白入门系列。单纯记录我的学习与问题,如果对你有帮助,我很开心,如果有什么建议,可以在评论区留言或者是私信,一起进步,谢谢。
在学习怎么画混淆矩阵的时候,知道了热力图(seaborn.heatmap()就可以画了),但是画出来的图片显示不全,如下图所示:
 我是Win10系统,python3.7版本。
查阅网上资料得知是matplotlib版本的问题,详情请见:https://stackoverflow.com/questions/56942670/matplotlib-seaborn-first-and-last-row-cut-in-half-of-heatmap-plot
于是我去查了一下我的matplotlib版本,通过以下命令:
 果然,我的版本是3.1.1。
网上说这是matplotlib 3.1.1版本的bug。这个bug官方文档已经指出来了,详情请见:https://github.com/matplotlib/matplotlib/issues/14731
解决方法之一就是升级或者降级matplotlib的版本。我自己捣鼓了很久的升级操作都没有成功。导致我的matplotlib库也不能用了。最终决定卸载,重新安装,果然,失败了,额。。。。。。。
查阅网上资料,最终尝试这个方法成功了。详情请见:
https://blog.csdn.net/sinat_26811377/article/details/99698807
决定升级,所以我安装的版本是3.1.2,输入如下命令:
pip --default-timeout=100 install matplotlib==3.1.2 -i http://pypi.douban.com/simple/ --trusted-host pypi.douban.com
成功了,速度真的很快。
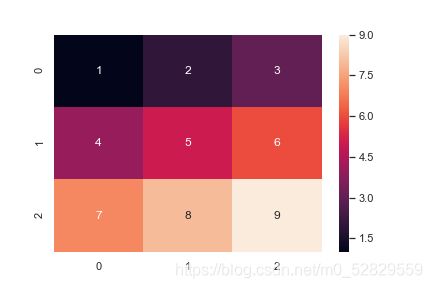
 最后再测试一下,画出了完整的热力图如下所示:
 给一个简单的例子吧(例子也是我抄来的哈哈):
#导入依赖包
import seaborn as sns
import matplotlib.pyplot as plt
import numpy as np
sns.set()
data = np.array([[1,2,3],[4,5,6],[7,8,9]])
sns.heatmap(data,annot=True)
plt.savefig('test1.png')
plt.show()
---------------------------这里是分隔符;2021.9.20再次更新----------
再次使用热力图的时候发现边界又显示不全了。matplotlib 3.1.2也出现bug了。再次猜想是版本的问题。
有两种解决方法:
- 升级matplotlib
- 人为改变坐标轴的刻度
方法1:
看了官网上的历史版本,我决定安装 3.3.1版本的试试。同样使用镜像源,安装速度会快很多。
pip --default-timeout=100 install matplotlib==3.3.1 -i http://pypi.douban.com/simple/ --trusted-host pypi.douban.com
尽管安装成功了但是报红色的错:
 ERROR: pip’s dependency resolver does not currently take into account all the packages that are installed. This behaviour is the source of the following dependency conflicts.
参考这篇文章找到解决教程:ERROR: pip‘s dependency resolver does not currently take into account all the packages that are inst
glue-core 0.15.6 requires mpl-scatter-density>=0.5, but you have mpl-scatter-density 0.4 which is incompatible.的意思是说要求使用mpl-scatter-density>=0.5,但是我现有的是0.4版本的。用pip list查看确实我现有的版本是0.4的。
同样使用镜像源安装:
pip install mpl-scatter-density -i https://pypi.mirrors.ustc.edu.cn/simple
(在此可以看这个帖子学习一下如何使用国内的一些镜像:python安装包国内镜像,pip使用国内镜像)
方法2:
我是看了这个帖子寻思着说改改试试:matplotlib Heatmap 绘制混淆矩阵第一行和最后一行减半
改完之后也能看,但是我的效果和帖子中的不太一样:

此文完!!!
