新冠疫情数据建模分析
4.2 湖北疫情数据预处理
import numpy as np
import pandas as pd
import matplotlib.pyplot as plt
import seaborn as sns
import matplotlib.dates as mdates

#读入中国省份疫情数据,设置时间格式的索引
history_province = pd.read_csv('./alltime_province_work.csv', index_col=0,encoding="utf-8")
history_province["日期"]=pd.to_datetime(history_province["日期"])
history_province.set_index("日期",inplace=True)
history_province.index.name = None

#从history_province中选取名称为湖北的数据,且选取的特征为累计确诊,累计治愈以及累计死亡
history_hubei = history_province.loc[history_province['名称']=='湖北',['累计确诊','累计治愈','累计死亡']]

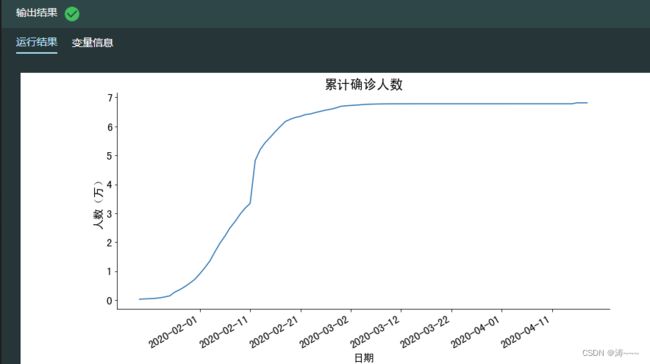
#可视化累计确诊人数
fig, ax = plt.subplots(figsize=(12, 6))
#选取湖北省数据中前90天的累计确诊数据进行绘图,不显示图例
sns.lineplot(data=history_hubei.iloc[:90,0],ax=ax,legend=False)

ax.set_xlabel('日期',fontsize=15)
ax.tick_params(labelsize=15)
plt.gca().xaxis.set_major_formatter(mdates.DateFormatter('%Y-%m-%d'))
plt.xticks(pd.date_range('2020-02-01','2020-04-18',freq='10d'))
plt.gcf().autofmt_xdate()
ylabels = [int(x) for x in ax.get_yticks()/10000]
ax.set_yticklabels(ylabels)
ax.set_ylabel('人数(万)',fontsize=15)
ax.set_title('累计确诊人数', size=18)
ax.patch.set_alpha(0)
sns.despine()
4.3 Logistic增长模型
import numpy as np
import matplotlib.pyplot as plt
import seaborn as sns

#请补充完成logistic_model函数
def logistic_model(x,v,d,s):
    return s/(1+np.exp(-(x-d)/v))
# def func(x, a,u, sig):
#     return  a*(np.exp(-(x - u) ** 2 /(2* sig **2))/(math.sqrt(2*math.pi)*sig))
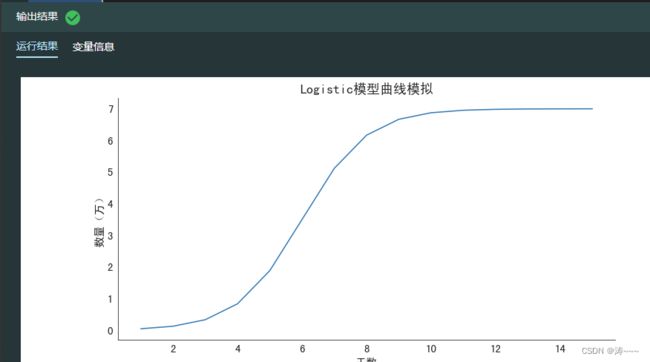
#给定参数,绘制Logistic模型曲线
x = np.linspace(1, 15, 15)
y = logistic_model(x, 1, 6, 7)
fig, ax = plt.subplots(figsize=(12, 6))
ax.plot(x,y)
ax.set_xlabel('天数',fontsize=15)
ax.tick_params(labelsize=15)
ax.set_ylabel('数量(万)',fontsize=15)
ax.set_title('Logistic模型曲线模拟', size=18)
ax.patch.set_alpha(0)
sns.despine()
4.4 训练Logistic模型
import numpy as np
import pandas as pd
from scipy.optimize import curve_fit
import matplotlib.pyplot as plt
import seaborn as sns

#选取30天的数据训练参数
xdata =list(np.linspace(1,30,30))
ydata =list(history_hubei.iloc[:30,0]/10000)
#拟合参数
popt, _ = curve_fit(logistic_model, xdata, ydata)
print("d = " + str(popt[1]) + ", s = " + str(popt[2]))

#绘制80天疫情累计感染人数的真实数据以及预测数据
fig, ax = plt.subplots(figsize=(12, 6))
x =list(np.linspace(1,80,80))
y =list(history_hubei.iloc[:80,0]/10000)

sns.lineplot(x,y, ax=ax)
sns.lineplot(x,logistic_model(x,*popt),ax=ax)

ax.lines[1].set_linestyle("--")
ax.set_xlabel('天数',fontsize=15)
ax.tick_params(labelsize=15)
ax.set_ylabel('人数(万)',fontsize=15)
ax.set_title('湖北累计确诊人数', size=18)
ax.legend(["实际值","预测值"], fontsize=15)
ax.patch.set_alpha(0)
sns.despine()
4.5 SIR模型介绍
import numpy as np

#SIR模型
def SIR(y, t, beta, gamma):
    """
     参数 y 为初始值,包括易感染人数S,感染人数I, 恢复人数R
     参数 t 为一组时间序列
     参数 beta 为感染率
     参数 gamma 为恢复率
     """
    #请根据方程补充SIR模型
    S, I, R = y
    dSdt =  -S*(I/(S+I+R))*beta
    dIdt =  beta*S*I/(S+I+R)-gamma*I
    dRdt = gamma*I
    return [dSdt,dIdt,dRdt]
输出 None
4.6 微分方程组求解
from scipy.integrate import odeint
import numpy as np
import matplotlib.pyplot as plt
import seaborn as sns

#设定初始值参数
N = 6000000  #某地区总人口数
I0 = 200  #现存感染者人数
R0 = 30  #累计恢复者人数
S0 = N - I0 - R0  #易感染者人数
y0 = [S0, I0, R0] #初始值
beta = 0.4
gamma = 0.2
#计算100天的人数变化情况
t = np.linspace(1,100,100)

# 使用odeint方法求解微分方程组的数值解
solution =  odeint(SIR,y0,t,args=(beta,gamma))

#转为DataFrame
data = pd.DataFrame(solution,columns=['易感染者人数', '现存感染者人数', '累计恢复者人数'])
#展示前五条数据
print(data.head(5))

# SIR曲线展示
fig, ax = plt.subplots(figsize=(12, 6))
sns.lineplot(data=data, ax=ax)

ax.set_xlabel('天数',fontsize=15)
ax.tick_params(labelsize=15)
ylabels = [int(x) for x in ax.get_yticks()/10000]
ax.set_yticklabels(ylabels)
ax.set_ylabel('人数(万)',fontsize=15)
ax.set_title('SIR模型模拟疫情发展', size=18)
ax.legend(fontsize=13)
ax.patch.set_alpha(0)
sns.despine()
4.7 SIR模型数据准备
import numpy as np
import pandas as pd

#提取出湖北的历史数据
history_hubei = history_province.loc[history_province['名称'] == '湖北',["累计确诊","累计治愈","累计死亡"]]

#湖北人口总数
N = 58000000

#获取实际的当日现存的感染人数,累计恢复人数以及易感染者人数
history_hubei["现存感染人数"] = history_hubei['累计确诊']-history_hubei['累计治愈']-history_hubei['累计死亡']
history_hubei["累计恢复人数"] = history_hubei['累计治愈']+history_hubei['累计死亡']
history_hubei["易感染人数"] = N-history_hubei['现存感染人数']-history_hubei['累计恢复人数']

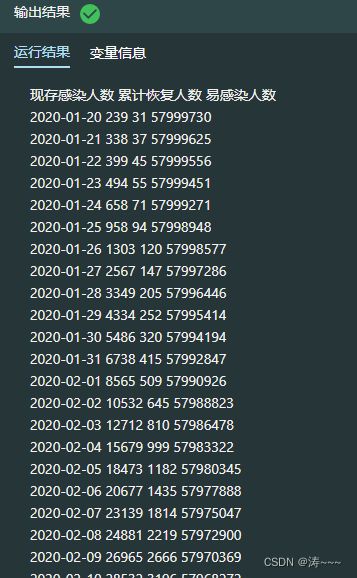
#选取当日现存的感染人数、累计恢复人数以及易感染者人数这三个特征的数据作为训练数据集
train_hubei = history_hubei[["现存感染人数", "累计恢复人数", "易感染人数"]]
print(train_hubei)

#获取湖北疫情数据中2020年1月20日的数据作为初始值
#感染人数初始值
I0 = train_hubei.loc['2020-01-20','现存感染人数']
#恢复人数初始值
R0 = train_hubei.loc['2020-01-20','累计恢复人数']
#易感染人数初始值
S0 = train_hubei.loc['2020-01-20','易感染人数']
y0 = [S0, I0, R0]
print(y0)
4.8 训练SIR模型参数
import numpy as np
import pandas as pd
from scipy.integrate import odeint
from scipy.optimize import minimize
from datetime import timedelta

#获取从2020-01-20开始5天内每天现存感染人数的数据和累计恢复人数的数据
time_span = 5
init_date = pd.to_datetime("2020-01-20")
target_date = init_date+ timedelta(time_span)
infectious = train_hubei["现存感染人数"][init_date:target_date]
recovered = train_hubei["累计恢复人数"][init_date:target_date]

#定义损失函数
def loss(params,func,infectious, recovered, y0):
    """
    params : 用于拟合的参数(beta,gamma)
    func: 这里主要用于传入SIR函数
    infectious : 当日现存感染人数的数据
    recovered : 当日累计恢复人数的数据
    y0 : 初始值
    """
    # 确定训练模型的天数
    days = len(infectious)
    # 设置时间跨度
    t = np.linspace(1,days,days)
    beta, gamma = params
    # 计算预测值
    solution = odeint(func, y0, t, args=(beta, gamma))
    # 计算每日的感染者人数的预测值和真实值的均方误差
    infectious_loss = np.mean((solution[:,1]-infectious)**2)
    # 计算每日的治愈者人数的预测值和真实值之间的均方误差
    recovered_loss = np.mean((solution[:,2]-recovered)**2)
    # 返回SIR模型的损失值
    return infectious_loss + recovered_loss

#训练loss函数
optimal = minimize(loss,
                    x0 =[0.1, 0.1],
                   args=(SIR,infectious,recovered,y0),
                   method='L-BFGS-B',
                   bounds=[(0.001, 1), (0.001, 1)])
# 获取参数
beta_opt, gamma_opt = optimal.x

print("beta_opt = {:.3f}, gamma_opt = {:.3f}".format(beta_opt, gamma_opt))
4.9 基本再生数
import numpy as np
import pandas as pd
from scipy.integrate import odeint
import matplotlib.pyplot as plt
import matplotlib.dates as mdate
import seaborn as sns

#计算基本再生数
R0 = beta_opt/gamma_opt
print("beta_opt= {:.3f}, gamma_opt = {:.3f}, R0 = {:.3f}.".format(beta_opt, gamma_opt, R0))

#可视化从2020-1-20日开始之后20天的疫情发展情况
time_span = 20
init_date = pd.to_datetime("2020-01-20")
target_date = init_date+ timedelta(time_span)

#准备数据
real_confirmed = train_hubei.loc[init_date:target_date,"累计确诊"] #实际数据
t = np.linspace(1,time_span+1,time_span+1)
#根据训练出的参数计算SIR数值解,即预测数据
solution = odeint(SIR,y0,t,args=(beta_opt,gamma_opt))
#将预测累计确诊数据封装成Series格式,累计确诊人数为累计恢复与现存感染人数的相加和
pred_confirmed =pd.Series(solution[:,1]+solution[:,2],index=real_confirmed.index,name="预测确诊")
#将两类数据联合起来
data = pd.concat([real_confirmed,pred_confirmed],axis=1)

#绘制实际与预测疫情数据的曲线
fig, ax = plt.subplots(figsize=(12, 6))
sns.lineplot(data = data,ax=ax)

ax.set_xlabel('日期',fontsize=15)
ax.tick_params(labelsize=15)
ylabels = [int(x) for x in ax.get_yticks()/10000]
ax.set_yticklabels(ylabels)
ax.set_ylabel('人数(万)',fontsize=15)
ax.set_title('湖北累计确诊人数', size=18)
ax.legend(["实际确诊","预测确诊"], fontsize=15)
# 设置横坐标标签显示的日期格式为月-日格式
ax.xaxis.set_major_formatter(mdate.DateFormatter('%m-%d'))
ax.patch.set_alpha(0)
sns.despine()
4.10 基本再生数变化曲线
import numpy as np
import pandas as pd
import matplotlib.pyplot as plt
import seaborn as sns
import matplotlib.dates as mdate
from scipy.integrate import odeint
from scipy.optimize import minimize

# 模型初始值函数
def get_init_value(data, timestamp):
    """
    获取三类人群的初始值
    data: 疫情数据
    timestamp: 初始时间,字符串格式
    """
    t = timestamp.strftime("%Y-%m-%d") #转成时间格式
    S0 = data.loc[t,"易感染人数"]
    I0 = data.loc[t,"现存感染人数"]
    R0 = data.loc[t,"累计恢复人数"]
    return [S0, I0, R0]

# 获取基本再生数序列函数
def reprod_nums(data,t1,t2):
    """
    计算从t1到t2的时间段内的基本再生数
    data: 疫情数据
    t1: 起始时间,字符串格式
    t2: 终止时间,字符串格式
    """
    reprod_nums =[]
    for t in pd.date_range(t1,t2):
        #选取时间窗口为5天(前后各取两天),获取窗口内的数据
        infected = data["现存感染人数"][t-timedelta(2):t+timedelta(3)]
        recovered = data["累计恢复人数"][t-timedelta(2):t+timedelta(3)]
        y0 = get_init_value(data, t-timedelta(2))

        #初始化SIRModel类,并调用SIRModel类中的fit方法
        model = SIRModel()
        model.fit(y0,infected,recovered)

        reprod_nums.append(model.get_reprod_num())
    return reprod_nums

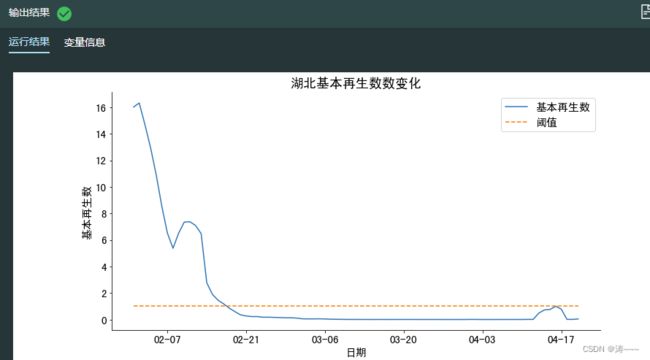
#绘制基本再生数曲线
fig, ax = plt.subplots(figsize=(12, 6))
#计算从2月1日到4月20日的基本再生数序列
res = reprod_nums(train_hubei,'2020-02-01','2020-04-20')

hubei_reprod=pd.Series(data=res, index=pd.date_range("2020-02-01","2020-04-20"))
sns.lineplot(data=hubei_reprod,ax=ax)
#绘制水平为1的阈值
ax.plot(hubei_reprod.index,len(hubei_reprod)*[1],'--')

ax.set_xlabel('日期',fontsize=15)
ax.tick_params(labelsize=15)
ax.set_ylabel('基本再生数',fontsize=15)
ax.set_title('湖北基本再生数数变化', size=18)
ax.legend(["基本再生数","阈值"],fontsize=15)
# 设置横坐标标签显示的日期格式为月-日格式
ax.xaxis.set_major_formatter(mdate.DateFormatter('%m-%d'))
ax.patch.set_alpha(0)
sns.despine()
4.11 使用SIR模型进行预测
import numpy as np
import pandas as pd
import matplotlib.pyplot as plt
import seaborn as sns
import matplotlib.dates as mdate
from scipy.integrate import odeint
from scipy.optimize import minimize

#选取湖北疫情3月初的数据进行训练以及预测
init_date = datetime(2020,3,1)
time_span = 5
target_date = datetime.date(init_date+ timedelta(time_span))

#使用5天的数据进行训练
#获取训练数据
infectious_hubei = train_hubei["现存感染人数"][init_date:target_date]
recovered_hubei = train_hubei["累计恢复人数"][init_date:target_date]
# 获取初始值
y0 = [N - infectious_hubei[0] - infectious_hubei[0], infectious_hubei[0], recovered_hubei[0]]

#使用模型进行训练
model = SIRModel()
model.fit(y0,infectious_hubei,recovered_hubei)
#获得参数
beta_opt, gamma_opt = model.get_optimal_params()
reprod_num = model.get_reprod_num()
print("beta = {:.3f}, gamma = {:.3f}, R0 = {:.3f}.".format(beta_opt, gamma_opt, reprod_num))

#重新定义目标时间,即SIR模型预测的时间长度
time_span2 = 35
target_date2 = init_date + timedelta(time_span2)

#准备数据
#从疫情开始到目标日期的实际数据
real_confirmed =train_hubei.loc[init_date:target_date2,"累计确诊"]

#根据训练的参数获取SIR数值解,即预测数据
solution = model.predict(y0,time_span2)
#将预测数据封装成Series格式
pred_confirmed =pd.Series(solution[:,1]+solution[:,2],index=real_confirmed.index,name="预测确诊")

#绘制实际和预测疫情数据的曲线
fig, ax = plt.subplots(figsize=(12, 6))
sns.lineplot(x=real_confirmed.index,y=real_confirmed,ax=ax)
sns.lineplot(x=pred_confirmed.index,y=pred_confirmed,ax=ax)

ax.lines[1].set_linestyle("--")
ax.set_xlabel('日期',fontsize=15)
ax.tick_params(labelsize=15)
ax.set_ylabel('人数',fontsize=15)
ax.set_title('湖北累计确诊人数', size=18)
ax.legend(["实际确诊","预测确诊"], fontsize=15)
# 设置横坐标标签显示的日期格式为月-日格式
ax.xaxis.set_major_formatter(mdate.DateFormatter('%m-%d'))
ax.patch.set_alpha(0)
sns.despine()
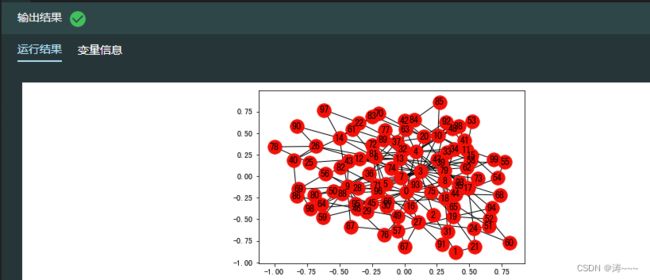
4.13 使用 NetworkX 生成无标度网络
import networkx as nx #导入networkx包,命名为nx
import matplotlib.pyplot as plt

# 使用 barabasi_albert_graph 函数生成无标度网络
random_network = nx.barabasi_albert_graph(100,2,seed=0) # 生成无标度网络,节点数和每个节点边数分别为100和2

#网络可视化
fig,ax = plt.subplots()
nx.draw_networkx(random_network,with_labels = True,pos = nx.spring_layout(random_network,random_state=1))
4.14 定义节点状态模拟更新函数
import random
import networkx as nx

# 根据 SIR 模型,更新节点的状态
def updateNodeState(G,node, beta, gamma):
    if G.nodes[node]["state"] == "I": #感染者
        p = random.random() # 生成一个0到1的随机数
        if p
输出 None
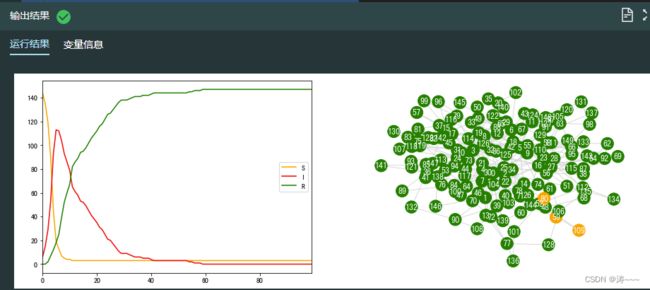
4.15 使用无标度网络进行 SIR 疫情模拟
import pandas as pd
import networkx as nx
import matplotlib.pyplot as plt
%matplotlib inline

# 计算三类人群的数量
def countSIR(G):
    S = 0;I = 0
    for node in G:
        if G.nodes[node]["state"] == 'S':
            S+=1
        elif G.nodes[node]["state"] == "I":
            I+=1
    return S,I, len(G.nodes) - S - I

#返回每一个节点的颜色组成的列表
color_dict = {"S":"orange","I":"red","R":"green"}
def get_node_color(G):
    color_list = []
    for node in G:
        #使用我们前面创建的状态到颜色的映射字典 color_dict
        color_list.append(color_dict[G.nodes[node]["state"]])
    return color_list

# 节点状态的初始化和 SIR 模型的参数β和γ的初始化
N=150
days = 100 #设置模拟的天数
beta = 0.30 #感染率
gamma = 0.10 #恢复率

ba = nx.barabasi_albert_graph(N,2,seed=1)

#初始化节点 state 属性
for node in ba:
    ba.nodes[node]["state"] = "S"

#随机选取一个节点为初始感染者
ba.nodes[55]["state"] = "I"

# 在图中开始 SIR 模型的模拟,模拟天数为days,更新节点状态
SIR_list = []
for t in range(0,days):
    updateNetworkState(ba,beta,gamma) #对网络状态进行模拟更新
    SIR_list.append(list(countSIR(ba))) #计算更新后三种节点的数量

# 对模拟的结果进行可视化
fig, ax = plt.subplots(1,2, figsize=(15, 5))

# 查看易感者、感染者和恢复者人数的变化趋势
df = pd.DataFrame(SIR_list,columns=["S","I","R"])
df.plot(color=[color_dict.get(x) for x in df.columns],ax=ax[0])

# 网络可视化
pos = nx.spring_layout(ba, random_state=1) #设置网络布局,将 random_state 固定为 1
ax[1].axis("off") #关闭坐标轴
plt.box(False) #不显示方框
nx.draw(ba,with_labels = True,font_color="white",node_color = get_node_color(ba), edge_color = "#D8D8D8",pos = pos, ax=ax[1])
4.16 初始感染者的影响
import numpy as np
import matplotlib.pyplot as plt
plt.rcParams['font.sans-serif'] = ['SimHei']

# 随机选择初始感染者
#初始化节点state属性
for node in ba:
    ba.nodes[node]["state"] = "S"
ba.nodes[64]["state"] = "I"

# 模拟days天,更新节点状态
SIR_list = []
for t in range(0,days):
    updateNetworkState(ba,beta, gamma)
    SIR_list.append(list(countSIR(ba)))
df = pd.DataFrame(SIR_list,columns=["S","I","R"])

# 选择度数最高的点作为初始感染者
# 使用networkx 的 degree_centrality 函数计算图中节点的度中心度
node_degree = nx.degree_centrality(ba)

node_degree_df = pd.DataFrame.from_dict(node_degree, orient = "index", columns=["degree"])
node_degree_df = node_degree_df.reset_index().rename(columns = {"index":"node"})

#选取度数最高的节点
node_degree_df.sort_values(by = "degree",inplace = True,ascending= False)

seed_node = int(node_degree_df.values[0,0])
print(seed_node)

#初始化节点 state 属性
for node in ba:
    ba.nodes[node]["state"] = "S"
ba.nodes[seed_node]["state"] = "I"

# 模拟days天,更新节点状态
SIR_list = []
for t in range(0,days):
    updateNetworkState(ba,beta, gamma)
    SIR_list.append(list(countSIR(ba)))

df_1 = pd.DataFrame(SIR_list,columns=["S","I","R"])


# 对模拟的结果进行可视化
fig, ax = plt.subplots(2,1, figsize=(10, 15))

df.plot(figsize=(9,6),color=[color_dict.get(x) for x in df.columns],ax=ax[0])
df_1.plot(figsize=(9,6),color=[color_dict.get(x) for x in df.columns],ax=ax[1])

ax[0].set_title('随机选择初始感染者',size=15)
ax[1].set_title('选择度数最高的点作为初始感染者',size=15)

plt.subplots_adjust(wspace =0, hspace =.4)#调整子图间距
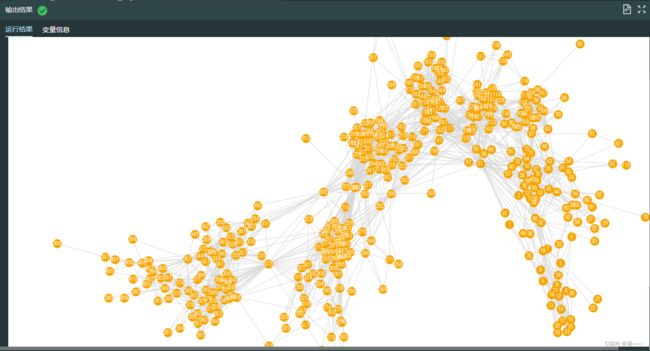
4.17 加载真实人群网络
import pandas as pd

data = pd.read_csv("./infectious.csv",header = None)
data.columns = ["node1","node2"]

import networkx as nx #导入networkx包,命名为nx
import matplotlib.pyplot as plt

infectious_network = nx.read_edgelist("./infectious.csv",delimiter=",")

fig, ax = plt.subplots(figsize=(24, 16)) #节点较多,将图片大小也调整大些

pos_infectious = nx.spring_layout(infectious_network, random_state= 22)
ax.axis("off")
plt.box(False)
nx.draw(infectious_network,with_labels = True,font_color="white", node_color = "orange", edge_color = "#D8D8D8",pos = pos_infectious, ax=ax)
4.18 真实人群网络中的 SIR 疫情模拟
import random
import networkx as nx
import matplotlib.pyplot as plt
import pandas as pd

beta = 0.10 # 为了更好观察,我们减小传染率参数
gamma = 0.05
days = 100 #设置模拟的天数

#初始化节点state属性,选择397号节点作为种子节点
for node in infectious_network:
    infectious_network.nodes[node]["state"] = "S"
infectious_network.nodes['397']['state']='I'

# 模拟days天,更新节点状态
SIR_list = []
for t in range(0,days):
    updateNetworkState(infectious_network, beta, gamma)
    SIR_list.append(list(countSIR(infectious_network)))

df_1 = pd.DataFrame(SIR_list,columns=["S","I","R"])

#初始化节点state属性,选择272号节点作为种子节点
for node in infectious_network:
    infectious_network.nodes[node]['state']='S'
infectious_network.nodes["272"]["state"] = "I"

# 模拟days天,更新节点状态
SIR_list = []
for t in range(0,days):
    updateNetworkState(infectious_network, beta, gamma)
    SIR_list.append(list(countSIR(infectious_network)))

df_2 = pd.DataFrame(SIR_list,columns=["S","I","R"])

# 可视化三类人群数量变化趋势
fig, ax = plt.subplots(2,1, figsize=(12,10))
plt.rcParams['font.sans-serif'] = ['SimHei']

df_1.plot(color=[color_dict.get(x) for x in df_1.columns], ax=ax[0])
df_2.plot(color=[color_dict.get(x) for x in df_2.columns], ax=ax[1])

ax[0].set_title('选择397号节点作为种子节点', size=15)
ax[1].set_title('选择272号节点作为种子节点', size=15)

plt.subplots_adjust(wspace =0, hspace =.3)#调整子图间距
